Technical Analysis: Pullback Time? | Internet News

Technical Analysis: Pullback Time?

Written By
Paul Shread
Paul Shread
Jul 17, 2007
1 minute read

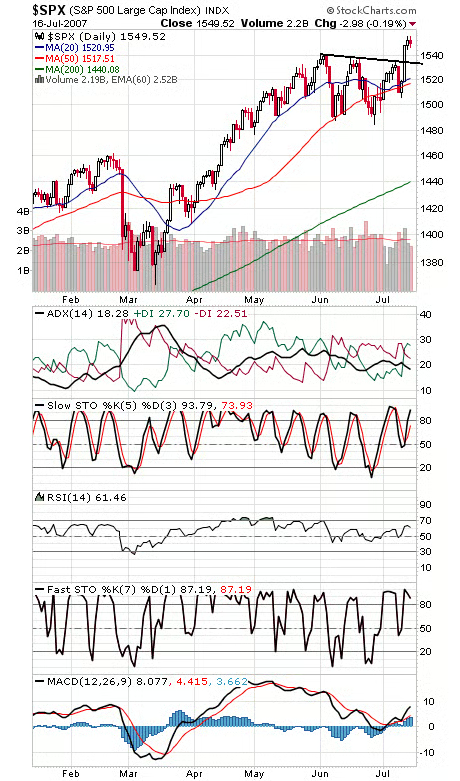
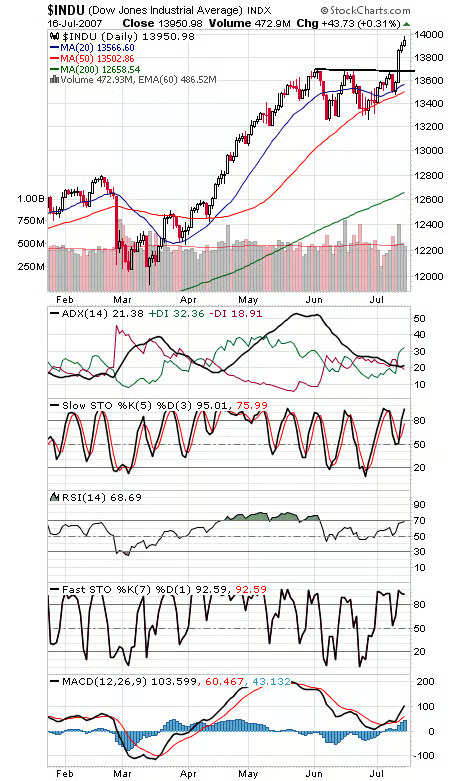
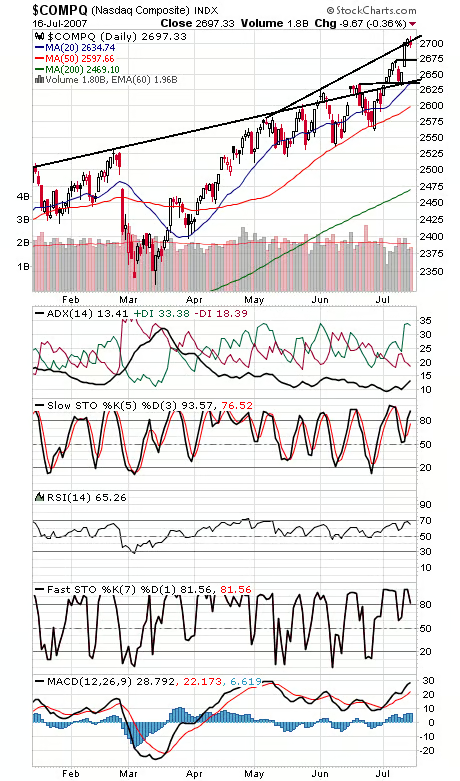
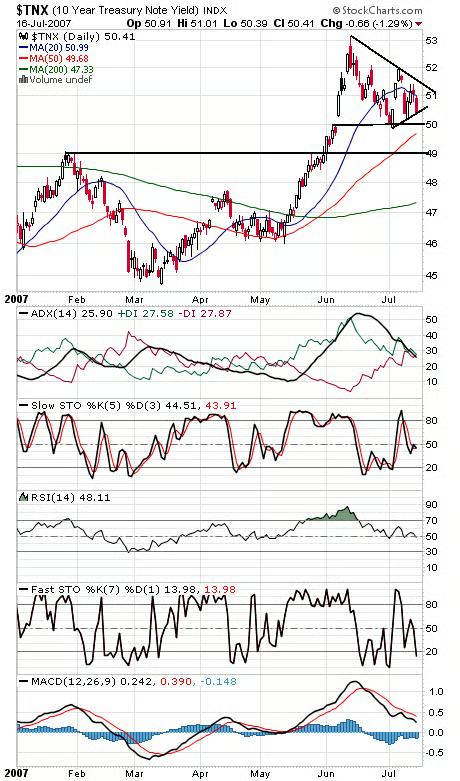
Dow 14,000 and the S&P’s March 2000 high of 1552.87 continue to give the market trouble, and with the broad list leading the way lower while the Dow edges higher, the market could be setting up for a pullback here. Support on the S&P (first chart below) is 1532-1540, while 1556 is providing some resistance here. The Dow (second chart) stalled just shy of 14,000 today, an obvious first resistance level. Support is 13,895-13,900, 13,800 and 13,670-13,700. The Nasdaq (third chart) is heading into a major resistance zone here, starting at 2750-2800 and carrying through 3000, that should take some time to get through. 2675 is first support, with gap support at 2652-2663 below that. The 10-year yield (fourth chart) remains stalled between 4.9-5.0% and the 5.25% neutral zone.

Paul Shread is a Chartered Market Technician (CMT) and member of the Market Technicians Association

Internet News Logo

InternetNews is a source of industry news and intelligence for IT professionals from all branches of the technology world. InternetNews focuses on helping professionals grow their knowledge base and authority in their field with the top news and trends in Software, IT Management, Networking & Communications, and Small Business.

Property of TechnologyAdvice. © 2026 TechnologyAdvice. All Rights Reserved

Advertiser Disclosure: Some of the products that appear on this site are from companies from which TechnologyAdvice receives compensation. This compensation may impact how and where products appear on this site including, for example, the order in which they appear. TechnologyAdvice does not include all companies or all types of products available in the marketplace.