A very nice-looking rally, but so far it’s nothing more than a retest of old support that’s now broken. And that makes this level the biggest resistance that the rally will face.
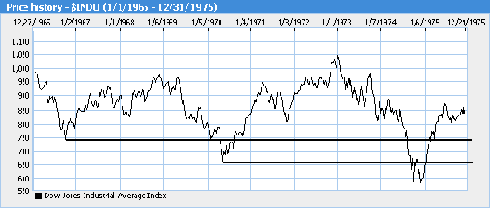
Returning to our analysis of the 1966 to 1974 bear market (see first chart at bottom), after breaking through the prior bear market lows (in this case, the 2002 lows), the stock market has now rallied back to retest that old support. If it’s going to form a major bottom, it now needs to get back above those levels and hold them for good.
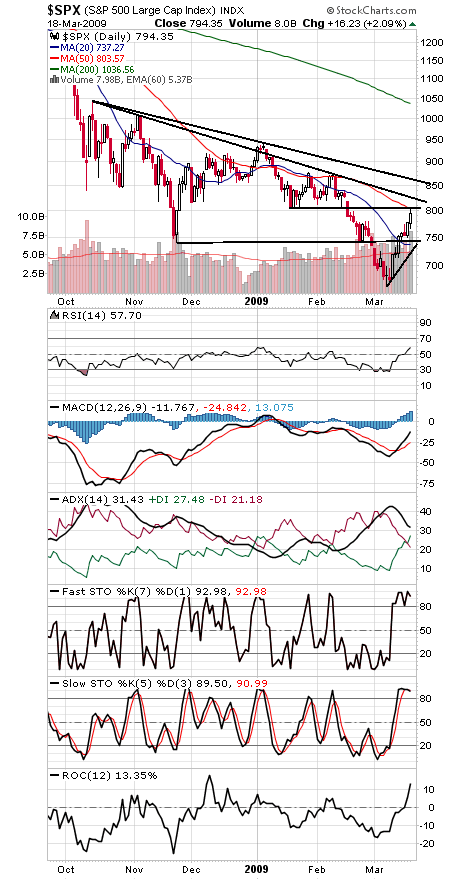
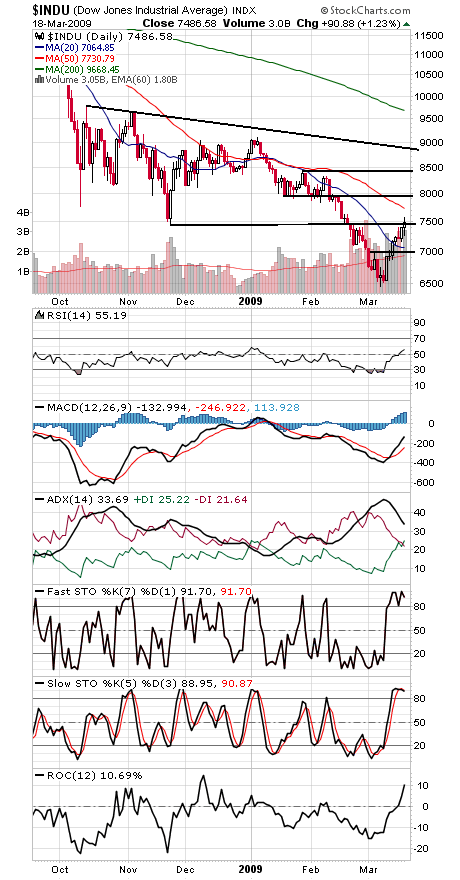
In 1970, the market got back above the 1966 low and held, while in 1974, the market stalled at the 1970 low and then retested its low to form a bottom. We’ve loosely defined the 2002 lows as 7200-7500 on the Dow and 768-789 on the S&P, so what happens next is critical.
On the plus side, there’s a lot of momentum, so some follow through is likely, but the market has rallied a great deal in a short period of time to a very important resistance level — a good formula for a pullback.
To the upside, a move above 804 and 825 on the S&P and 7730 and 7900-8000 on the Dow would further bolster the bullish case (see charts two and three), while in an ideal world, 768 and 7192 would hold as support. Below that, 741-752 and 7000 are the next support levels.
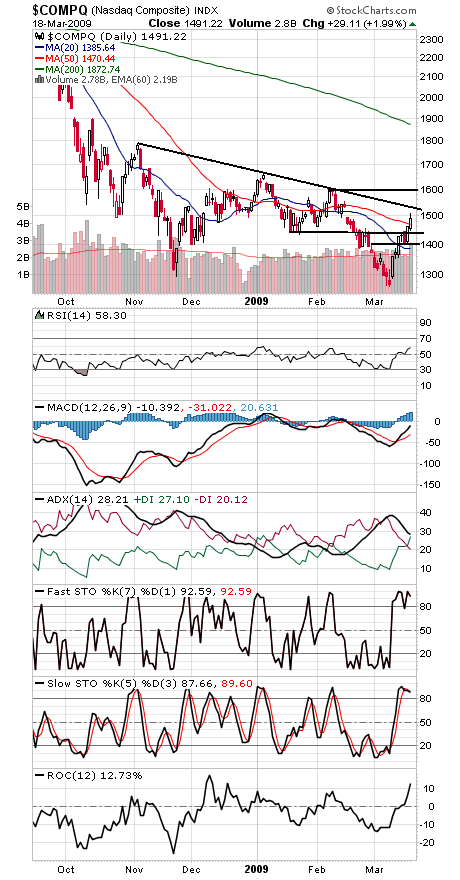
The Nasdaq (chart four) faces important resistance at 1525 and 1600, and 1470, 1440 and 1400 are support.
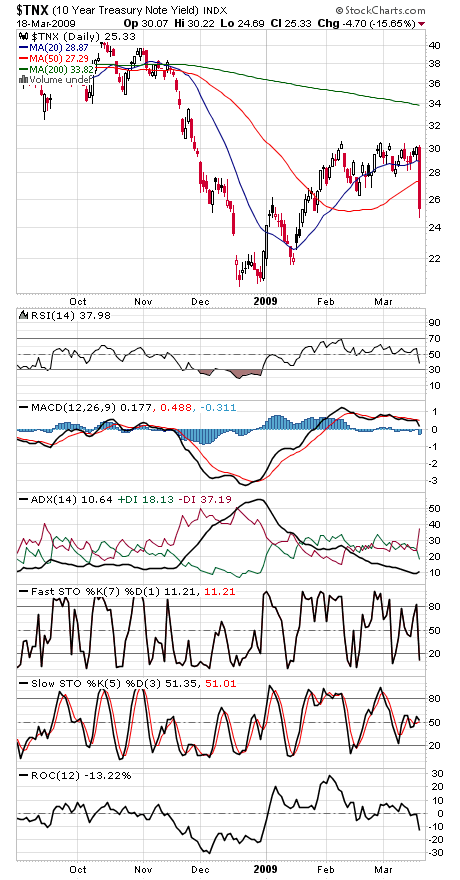
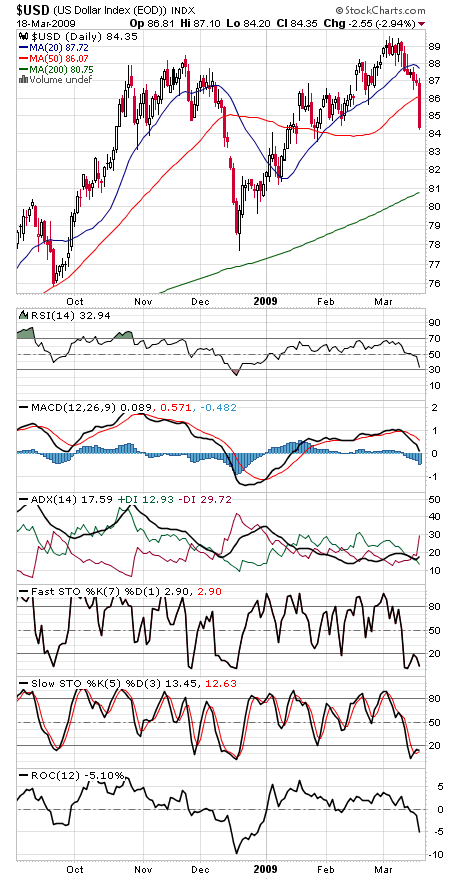
And finally, astonishing moves in bonds and the dollar today (charts five and six). Let’s hope the Fed is getting what it wants.
Paul Shread is a Chartered Market Technician (CMT) and member of the Market Technicians Association. He is a co-author of an upcoming book on Dow Theory from W&A Publishing.
