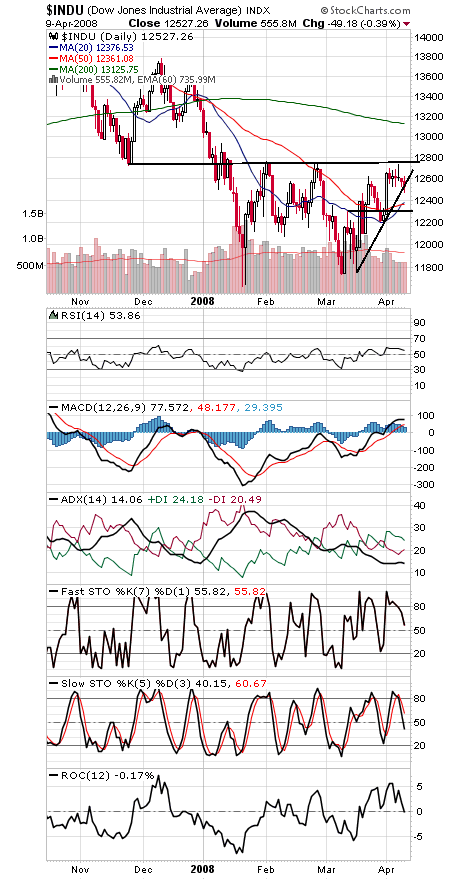
The major indexes broke short-term uptrends today as they continue to remain stuck just below the key 12,743.2 level on the Dow (first chart below).
On the plus side, sentiment remains remarkably bearish, with six straight weeks of more bears than bulls in the Investors Intelligence survey. Yet market bulls have been unable to use that support to send the indexes through some major resistance levels.
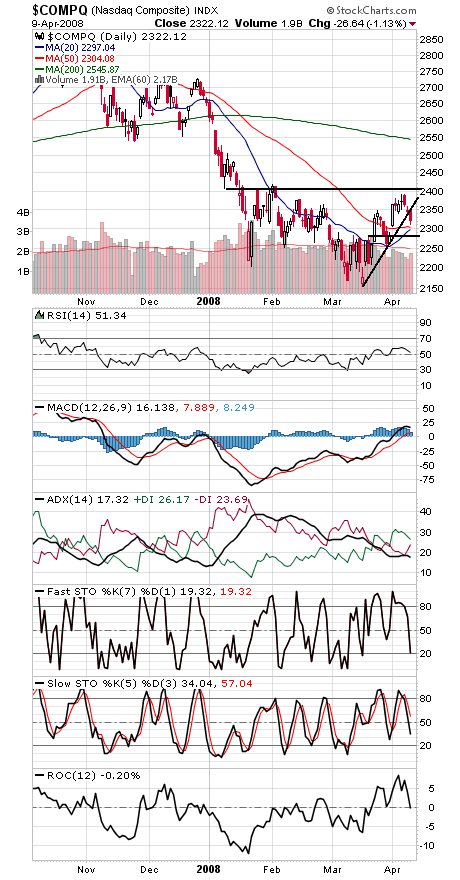
With short-term uptrends gone, the 50-day averages are now the next obvious support level, at 12,361 on the Dow, 1342 on the S&P (second chart) and 2304 on the Nasdaq (third chart). 12,303 on the Dow and 2280 on the Nasdaq are the next obvious support levels below that, but 1342 on the S&P would be a good level for the bulls to defend.
To the upside, 1375 and 1387-1406 on the S&P and 2365 and 2390-2419 on the Nasdaq are the levels to beat. 12,600 is first resistance on the Dow.
Paul Shread is a Chartered Market Technician (CMT) and member of the Market Technicians Association.