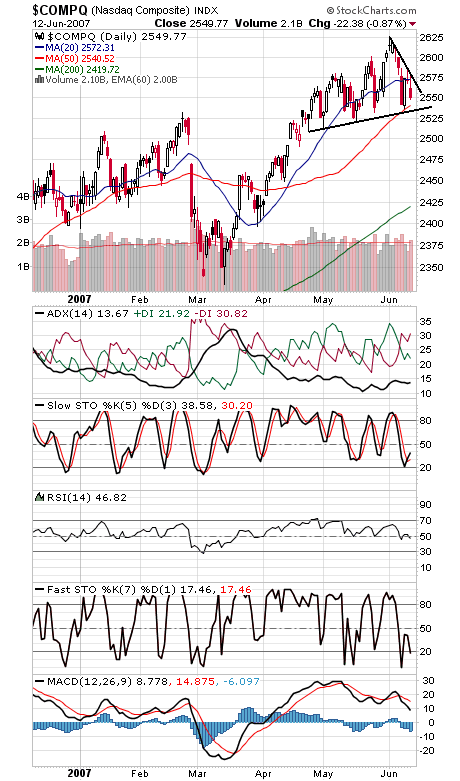
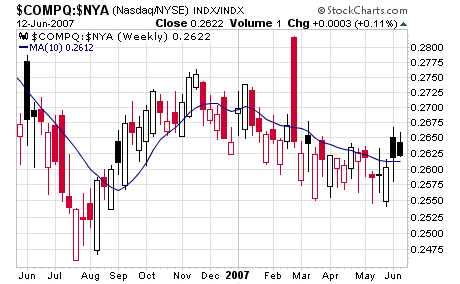
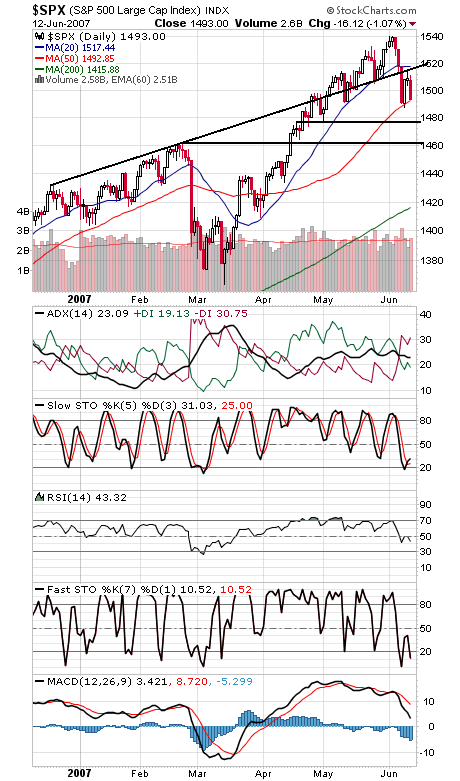
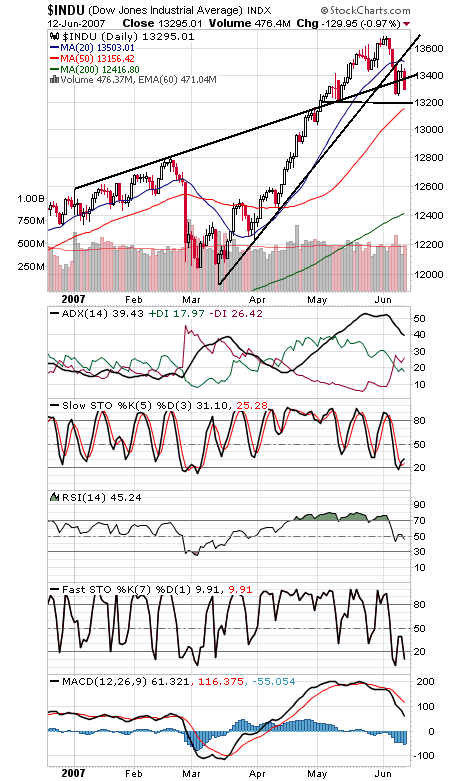
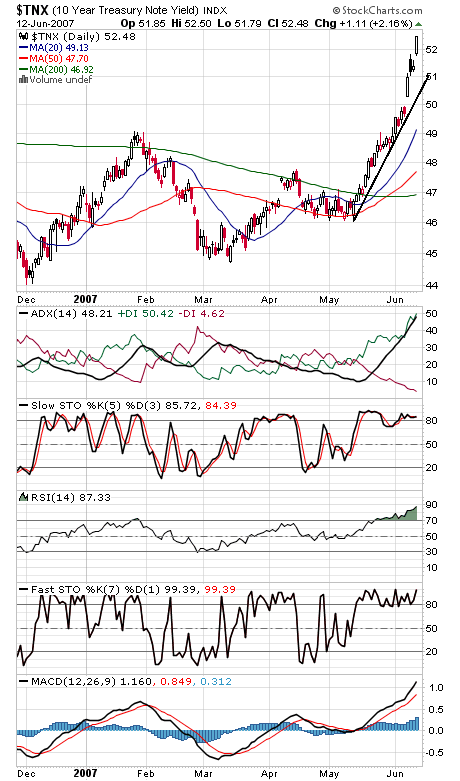
The market appears to be well on its way to a retest of last week’s lows of 13,251 on the Dow, 1487 on the S&P and 2535 on the Nasdaq. 2543 is first support on the Nasdaq (first chart below), and a sharp downtrend line at 2573 is the main hurdle to the upside. On the plus side, the index has so far held onto last week’s buy signal (second chart); we’ll call that a positive divergence if it holds on a full retest. The S&P (third chart) closed right on its 50-day average. If 1487 goes, 1477 is next support, and 1517 is the level to beat to the upside. The Dow (fourth chart) faces resistance at 13,400 and 13,500, and 13,251, 13,200 and 13,160 are support. The 10-year yield (fourth chart) is now neutral here at 5.25%; where it goes from here could say something about both inflation and the economy.
Paul Shread is a Chartered Market Technician (CMT) and member of the Market Technicians Association
