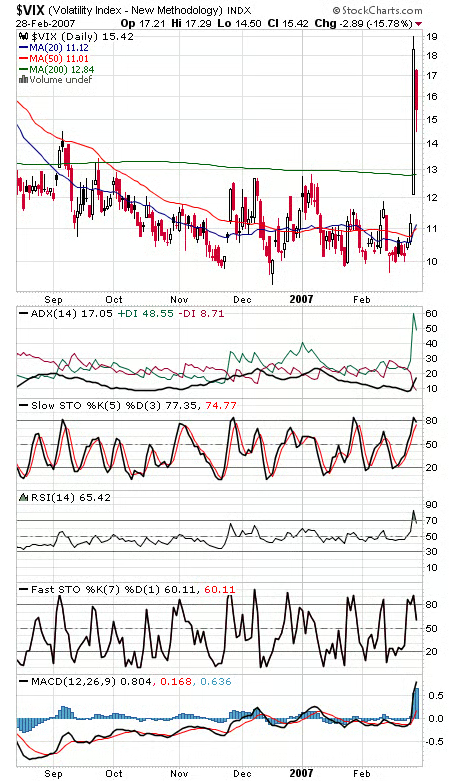
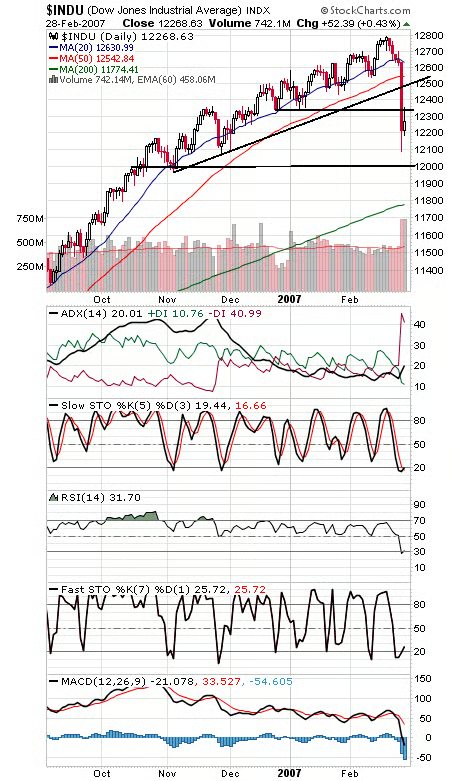
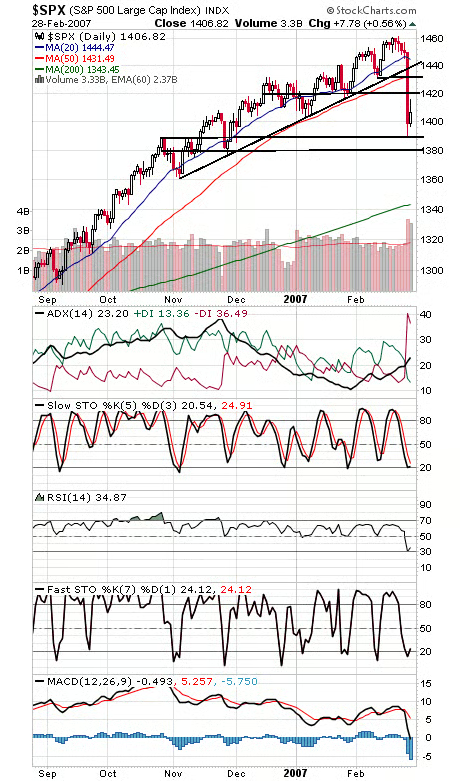
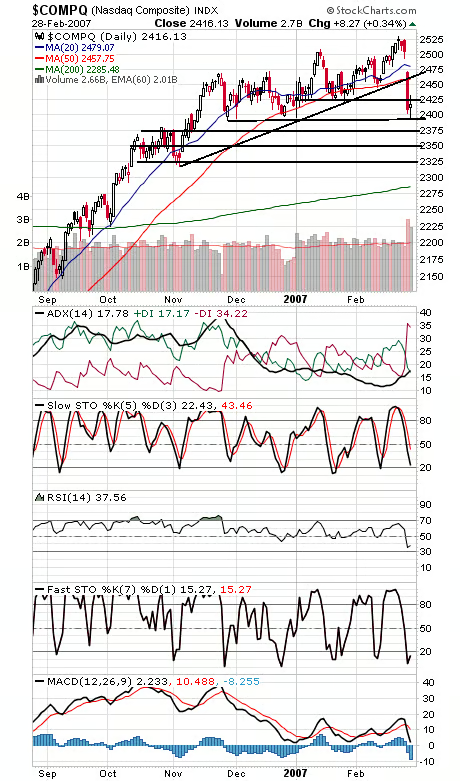
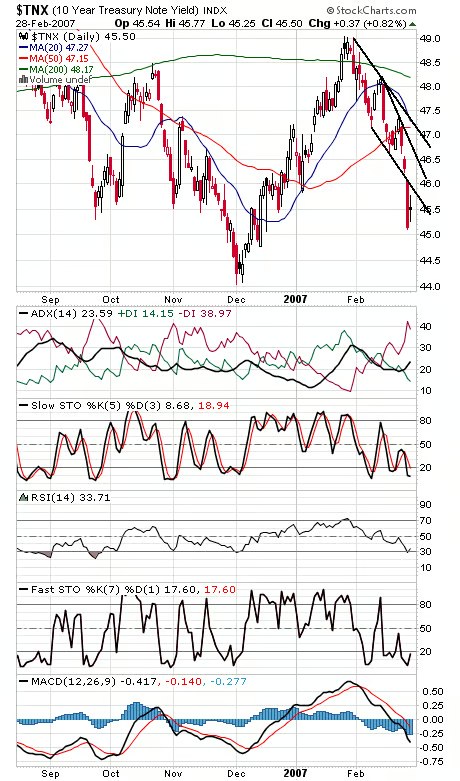
Today’s rocky trade could be the pattern for a while, as stocks try to hammer out a bottom. A retest of Tuesday’s lows is likely at some point, and lower lows with plenty of fear and positive divergences might be the best scenario. So far it appears that Tuesday’s plunge is being viewed as an anomaly, and while we tend to agree, we wish the opinion wasn’t so widespread. We’ll watch closely to see if any bearish patterns develop on bounces. With first-of-the-month inflows still ahead of us, there should be more to this bounce. If you’re looking for a possible all-clear signal, the options volatility index (first chart below) could be worth watching. Buying the S&P when the VIX closes below its 200-day average and selling when it rises back above has been a profitable trade about 75% of the time since 1993; it would have had you long from mid-September until yesterday. The Dow (second chart below) stalled at our first resistance level of 12,350, with 12,500 a bigger test. Support is 12,186 and 12,086. Interesting to note that +DI, or buying pressure in the ADX indicator, is nearing the oversold 10 level, more evidence for a bounce. The S&P (chart three) has first resistance at 1416-1420, and support is 1397-1400 and 1389-1390. The Nasdaq (fourth chart) had a volatile day. 2431 is resistance, and 2390-2400 is important support. Bonds (fifth chart) gave back a little today, as expected.