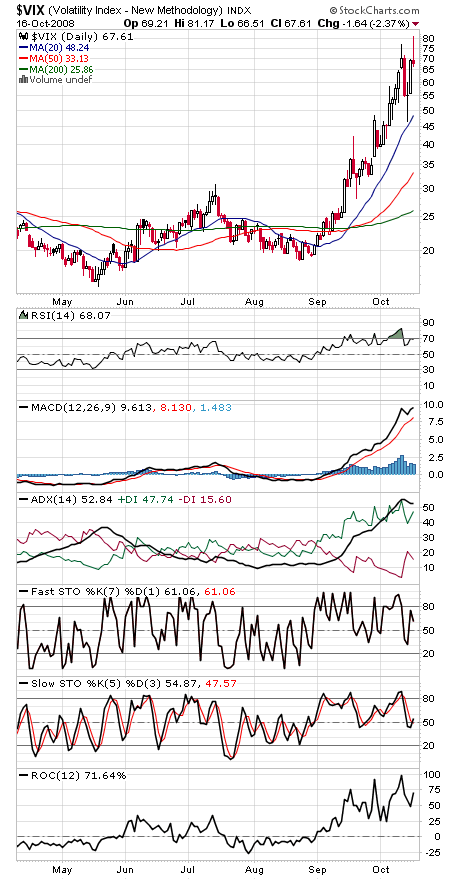
A nice attempt at a double bottom by the major indexes, and we like that the higher lows on the major indexes coincided with a higher high on the VIX (the “fear index,” first chart below), a positive divergence in sentiment — investors were more scared today than they were at lower levels last Friday.
The market has been as oversold as any in history, and sentiment as bearish as any seen in decades, but it takes time to form a major bottom, and so far we have a bare beginning.
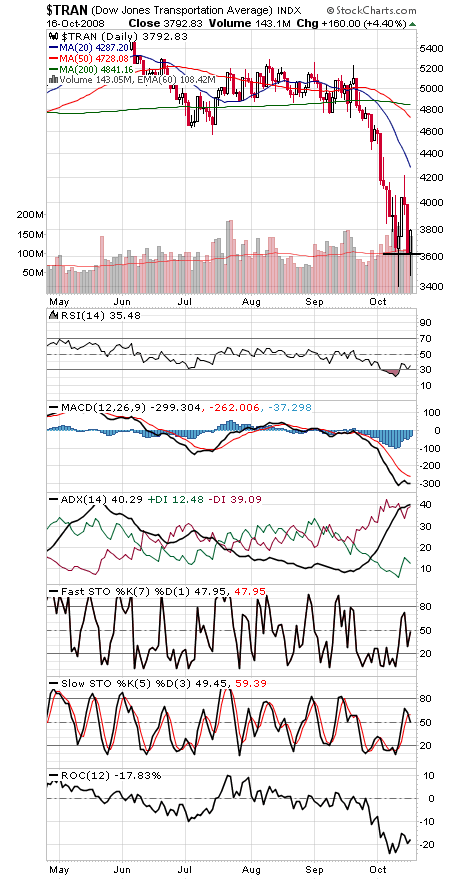
One negative we’d note here is a lower closing low yesterday in the Transports (second chart), which means at best that it would take some time for a reliable Dow Theory buy signal to form. Weakness in a very important index.
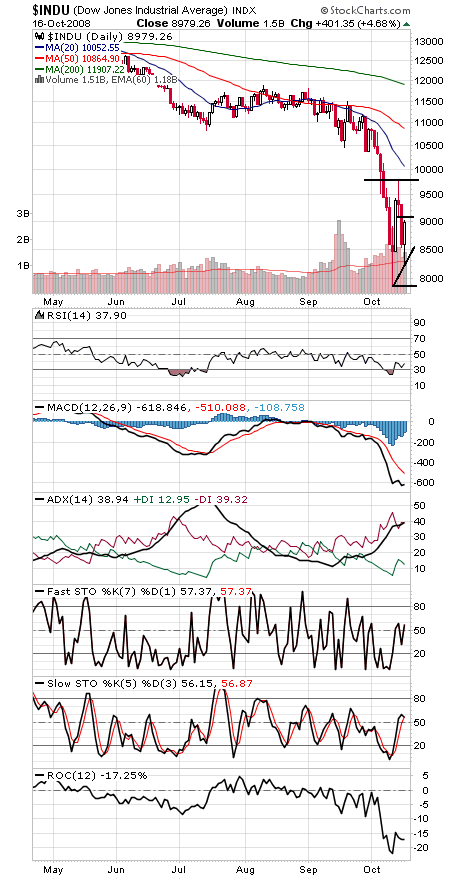
The levels on the Dow (third chart below) to watch are 9085, 9311-9387 and 9794, and support is 8387-8579, 8200, 8000 and 7882.
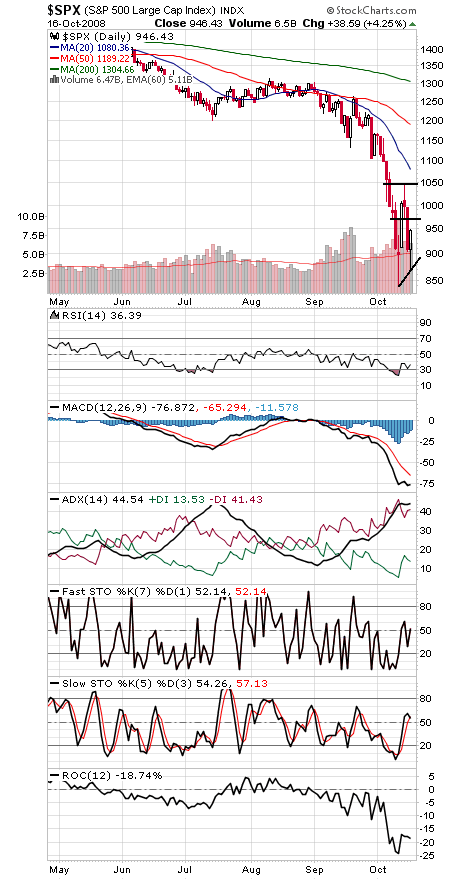
The S&P (fourth chart) faces resistance at 972, 1000 and 1044-1060, and support is 900, 880, 865 and 839.
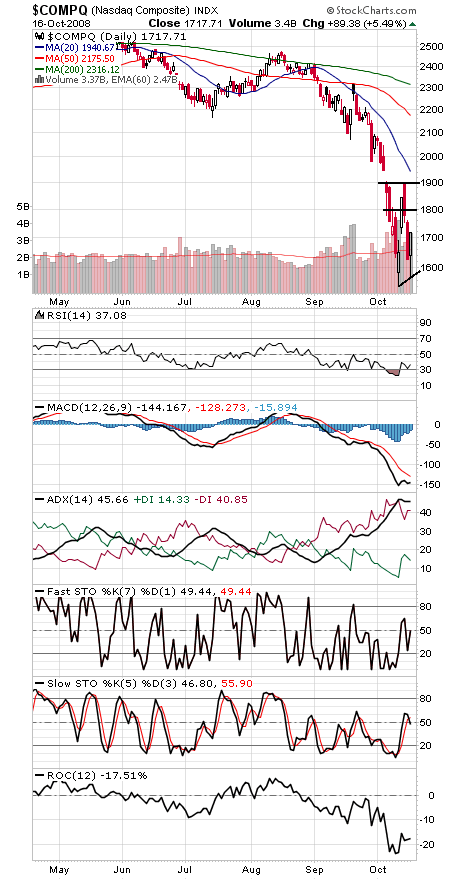
The Nasdaq (fifth chart) faces resistance at 1754-1779, 1800 and 1900, and support is 1628-1645, 1580, 1565 and 1542.
Paul Shread is a Chartered Market Technician (CMT) and member of the Market Technicians Association.