Moving averages and Dow Theory have been positive for months, but now the stock market may have even more support, according to one old theory.
November through April have typically been the stock market’s strongest months for much of the post-World War II era, but after a roughly 60 percent gain since the March lows, it’s probably a safe bet that the market won’t be duplicating that performance in the next six months. Still, seasonal strength could be one more factor in favor of the bulls in the months ahead. As of Friday’s close, seasonality turned positive, according to the work of Sy Harding, which adds one more supporting factor for the market here.
Still, we’d be surprised if the market makes it through the next six months without the first significant pullback since the bull run began earlier this year.
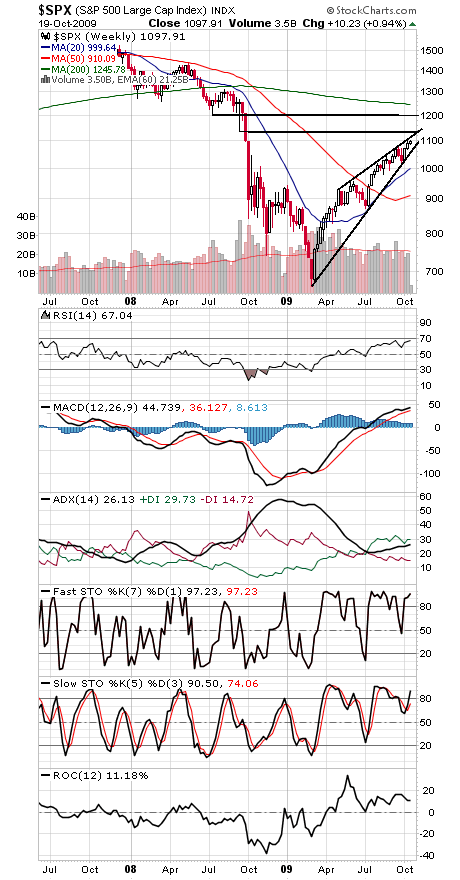
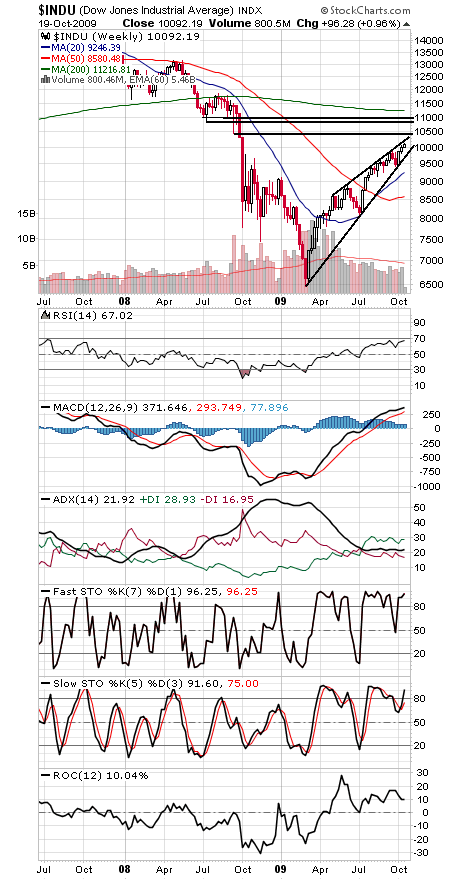
1133 and 1200 on the S&P and 10,459 and 10,683-10,827 on the Dow should prove formidable resistance for the market, and as good a place as any to look for that pullback (see first two charts below).
10,683 could prove to be an important market fulcrum for some time, as it was the first mid-term election year low to be broken prematurely since 1930. The 1930 low played an important role in the market for the next 19 years (see third chart below, courtesy of MSN MoneyCentral). With any luck, the market will do a little better this time, but Dow 10,000 has already been trouble for the market for 10 1/2 years.
In a word, the technicals may all be positive, but the major indexes are coming up on some pretty hefty resistance. On the plus side, sentiment surveys like Investors Intelligence still show that investors remain skeptical of the rally, another supporting factor here.
The Dow has important support at a trendline at about 9750 and rising, while the S&P has that same trendline at 1060 and rising.
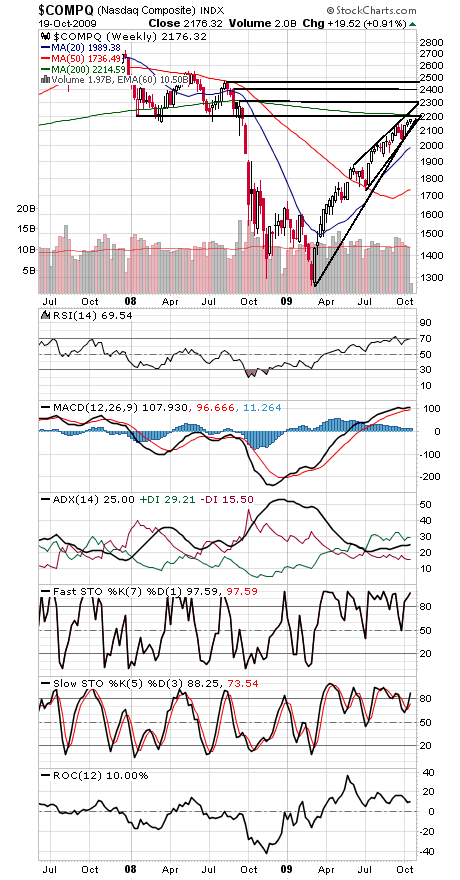
The Nasdaq (fourth chart below) is coming up on important resistance at 2200-2214, with 2300 and 2400 possible above that, although a rising upper trendline could slow the index’s ascent starting at around 2250 and rising. Support for the Nasdaq is at 2140 and 2110 and rising.
Paul Shread is a Chartered Market Technician (CMT) and member of the Market Technicians Association. He is a co-author of the book “Dow Theory Unplugged” from W&A Publishing.