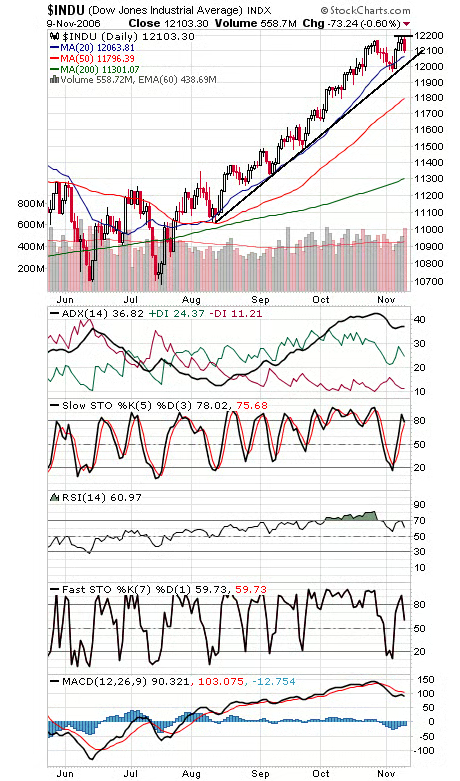
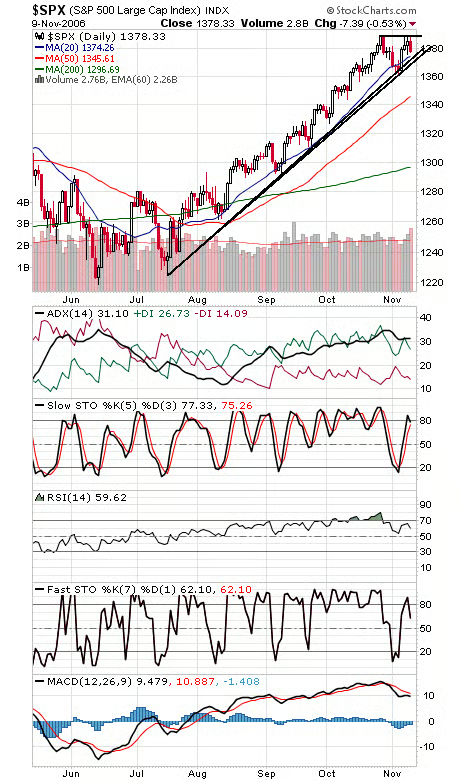
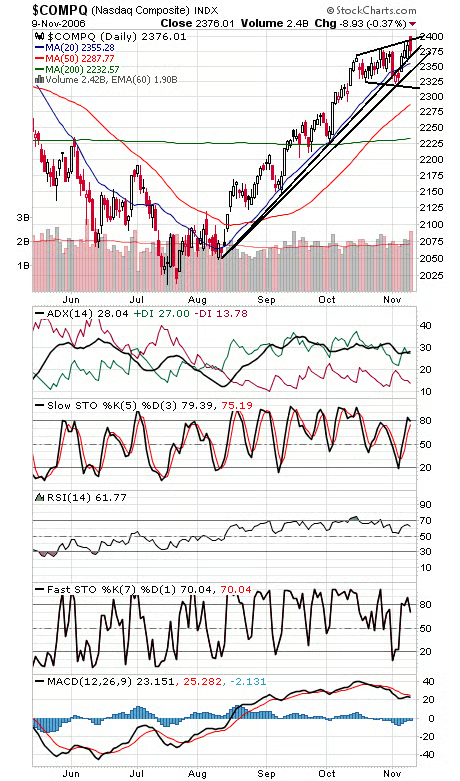
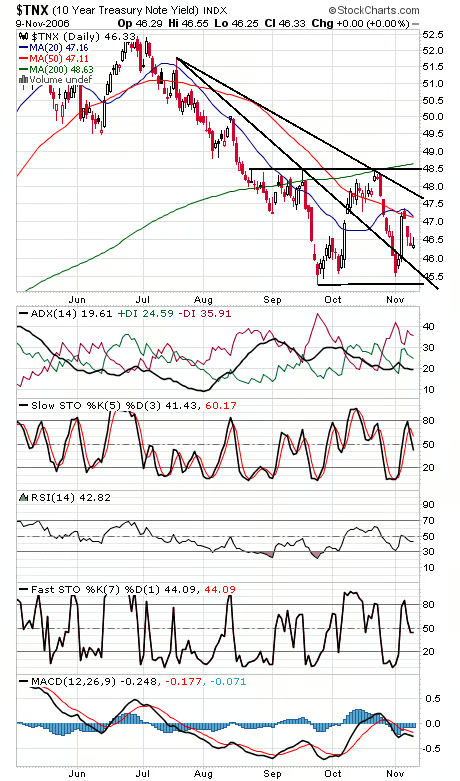
An interesting day today. We got a bit of giddiness on the part of options traders early today (see “View Intraday Data”), which turned out to be enough to spark a sell-off. So where do we go from here? Once again, keep your eyes on support, particularly the 12,015 level on the Dow (first chart below) and 1376-1377 on the S&P (second chart). If those go, we may finally see a correction of note. It’s also worth noting that RSI has turned back down on the indexes after failing to get back above 70, a negative divergence. To the upside, the big caps are struggling at 12,200 and 1389. The Nasdaq (third chart) had a bit of a “fakeout” today, gapping above rising resistance and then reversing to close below it. Resistance is 2397-2400, and 2373 is important first support. Bond yields (fourth chart) remain stalled here.