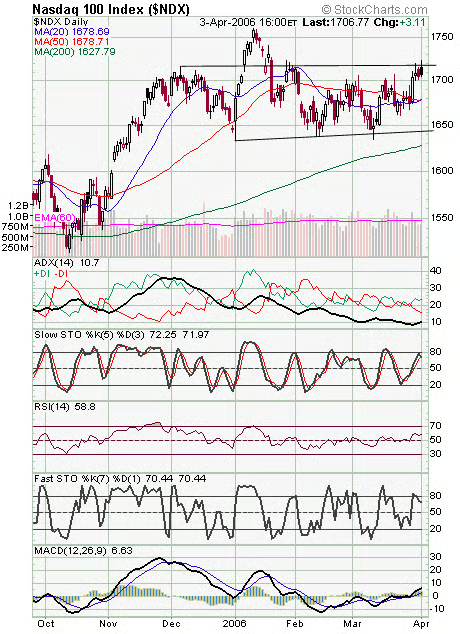
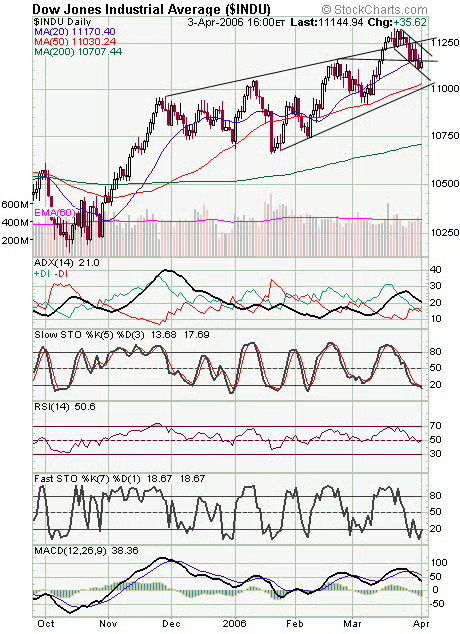
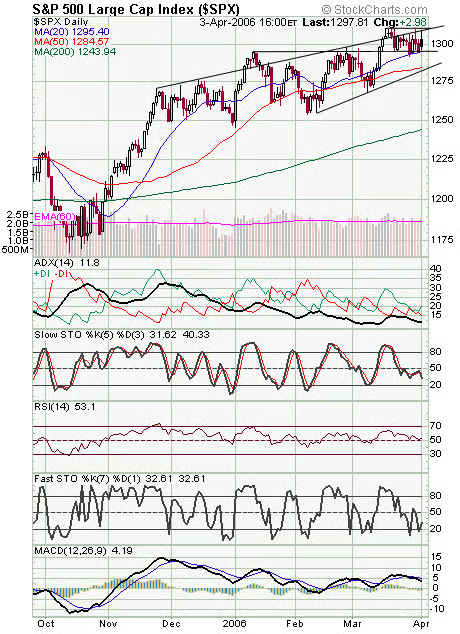
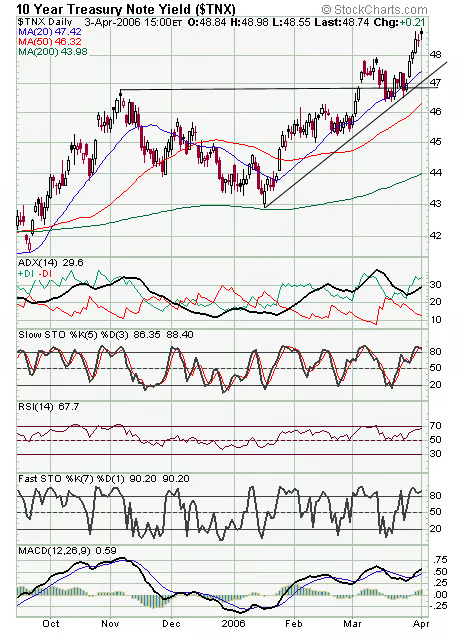
One sign of how weak today’s rally was was that small caps never participated, ending the day down nearly 1%. The lack of broad-based buying opened the door for sellers. So where do we go from here? If bearish patterns on the Nasdaq and Nasdaq 100 (first two charts below) play out, the market could be in for a correction here. That said, the Nasdaq continues to hold 2328-2333 support beautifully, and below that, at 2325 is the lower rising wedge line that is rising at five points a day, making for even more support around 2330 on Wednesday. To the upside, 2357-2360 is resistance for tomorrow. The Nasdaq 100 has yet to push through the 1717-1720 level convincingly, so that index remains in a potential topping pattern too. The Dow (third chart) failed once again at 11,230-11,250 resistance, and 11,000-11,050 remains important support. The S&P (fourth chart) continues to stall at 1310 resistance, with 1316 above that. Support is 1295, 1290 and 1285. A doji star on long bond yields (fifth chart) today; a possible change in direction in the wind?