Intense selling pressure at the open today, with more than 90% of all stocks trading to the downside at one point. Breadth had improved by the close, but things were still bad enough so that just 11 stocks made new 52-week highs, compared to 1154 new lows — the highest number of new lows since the 1998 market lows, when the number of new lows hit 1209.
So was it enough for a bottom? If not, a bottom shouldn’t be far off. We expect a few positive data points this week for the bullish case, one of which came today: a DeMark TD Sequential buy signal on the Dow.
We expect another positive data point tomorrow, when Investors Intelligence bears will likely exceed 50% for the first time since 1994. And if stocks can’t bounce by the end of the week, we expect the Dow to register its most oversold reading since late September 2002.
But all those positive data points aren’t much help if stocks can’t catch a bid. A higher short-term high on the indexes would be a good place to start.
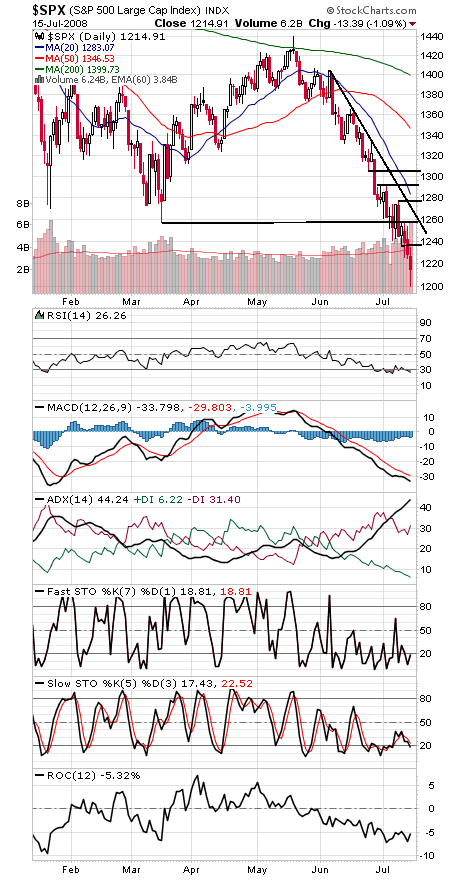
For the S&P (first chart below), that would mean a move above 1257, with first resistance at 1236, and 1265, 1277, 1292 and 1304 are above that. 1167-1177 is next support if the index can’t hold 1200 on a retest.
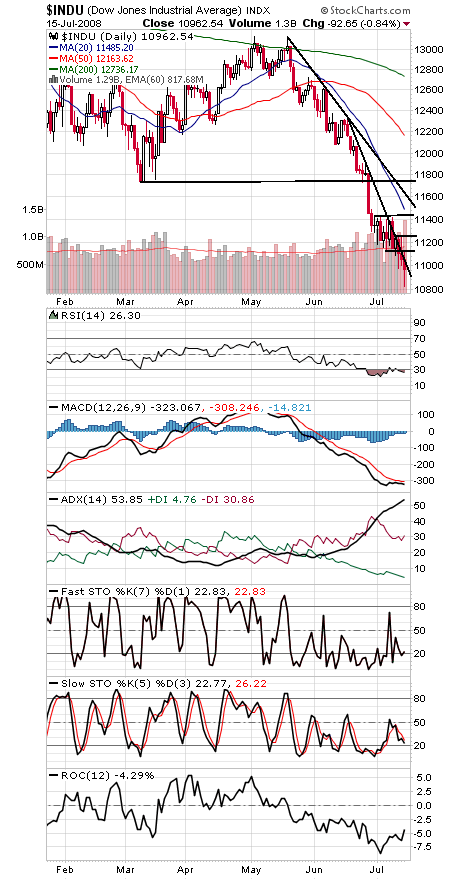
The Dow (second chart) has critical support at 10,683-10,739; today’s low was 10,827. To the upside, the Dow needs to clear 11,123, 11,270, 11,434-11,485 and 11,634-11,750.
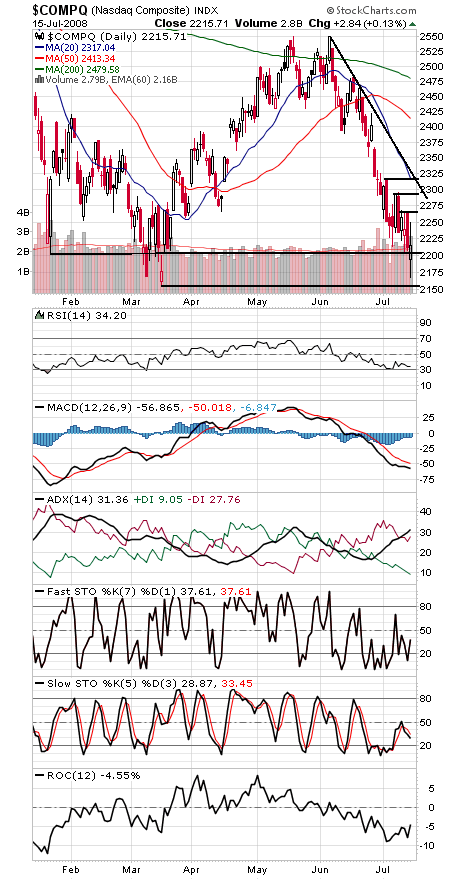
The Nasdaq (third chart) held above its March low of 2155, bouncing at 2167. First support is 2200, and 2249, 2267, 2280, 2294 and 2317 are resistance.
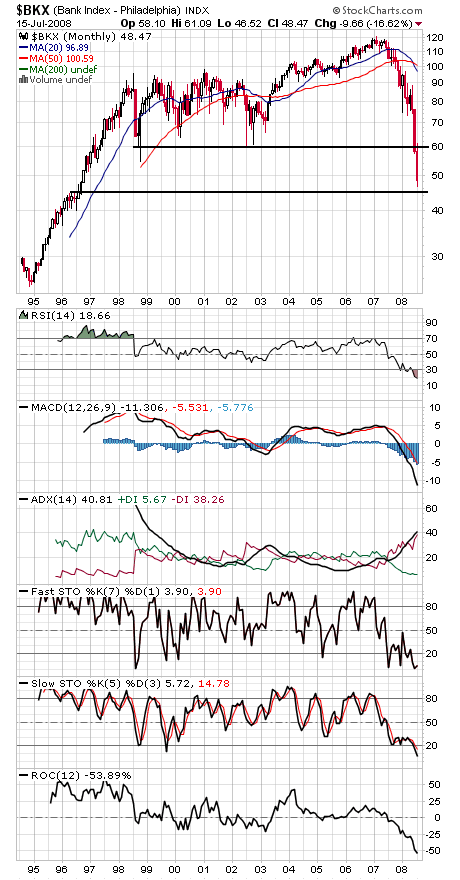
Finally, the bank stocks (fourth chart) stopped just above the mid-1996 highs; how’s that for historic damage? With any luck, the bleeding will stop soon.
Paul Shread is a Chartered Market Technician (CMT) and member of the Market Technicians Association.


