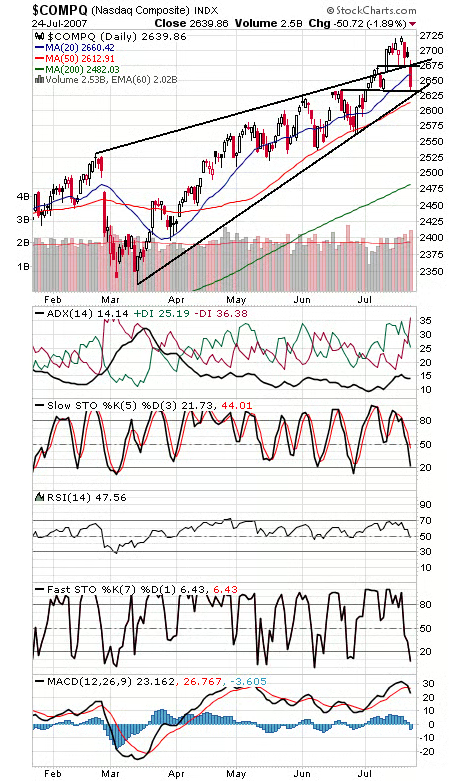
Selling pressure today reached its highest levels since June 7 — a day that marked the low of the last couple of months for the Dow and Nasdaq. The good news is that such intense bouts of selling can mark capitulation and could mean that we aren’t too far from a market low, and unless the major indexes take out their June lows, we think that’s likely the case here. Coming straight off new all-time highs for the Dow and S&P adds to the likelihood.
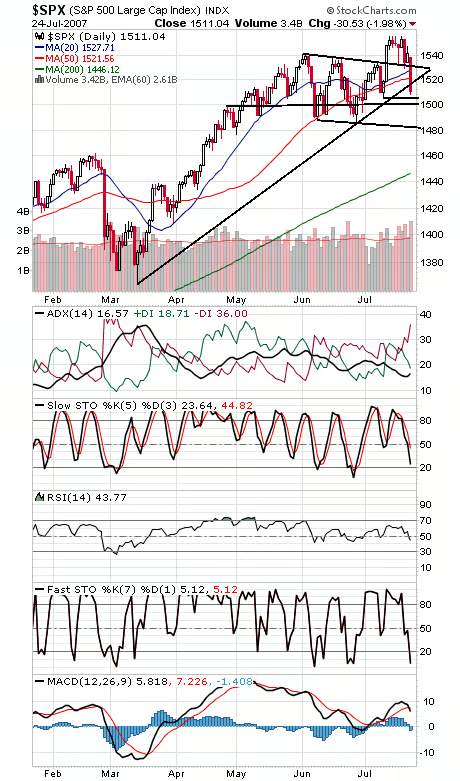
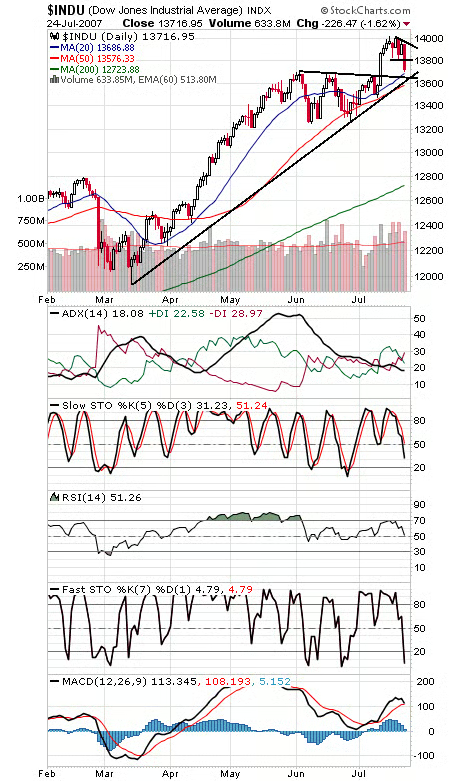
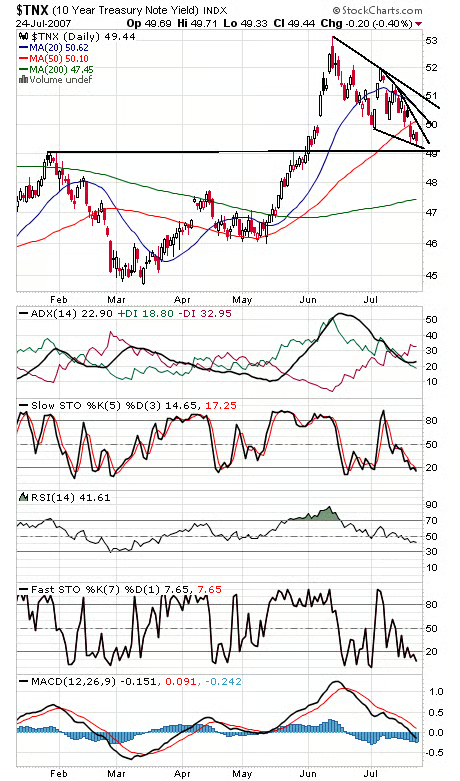
The Nasdaq (first chart below) has important support at 2625-2634, with 2615 below that. 2660 and 2674-2677 is resistance. The S&P (second chart) has first support levels at 1505 and 1500 before 1482-1493 comes into play. 1518-1521 is first resistance. The Dow (third chart) has support at 13,690-13,700, 13,650 and 13,580, and resistance is 13,800-13,820. The 10-year yield (fourth chart) is stuck between 4.9% and 5.0%.
Paul Shread is a Chartered Market Technician (CMT) and member of the Market Technicians Association