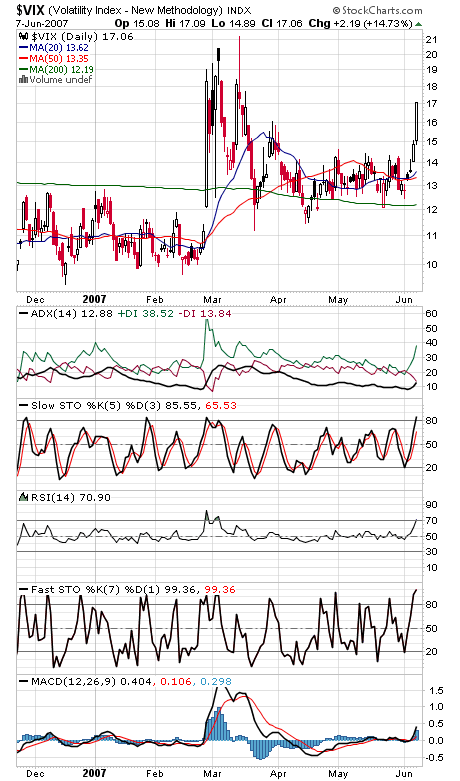
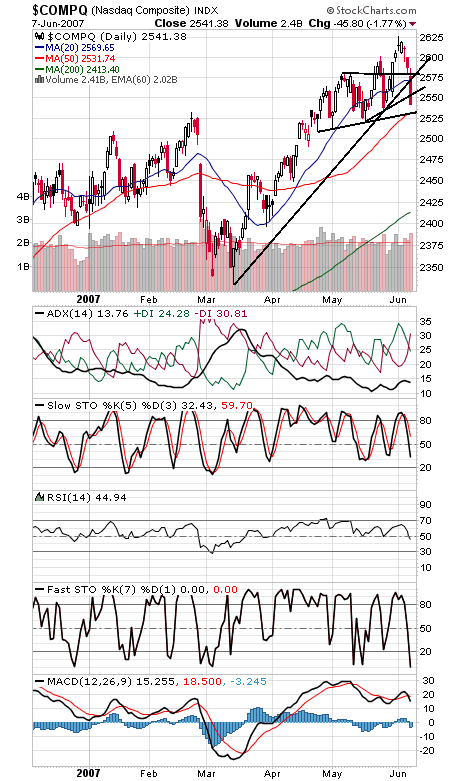
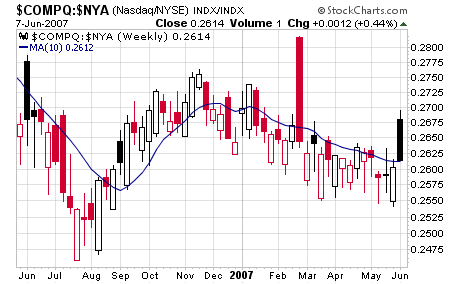
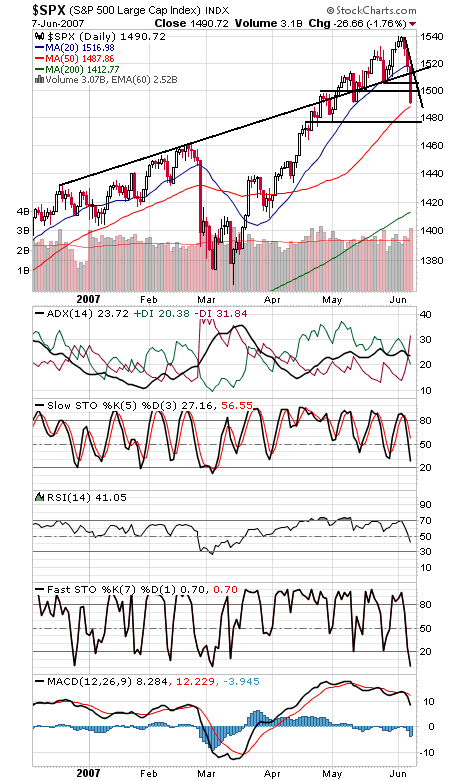
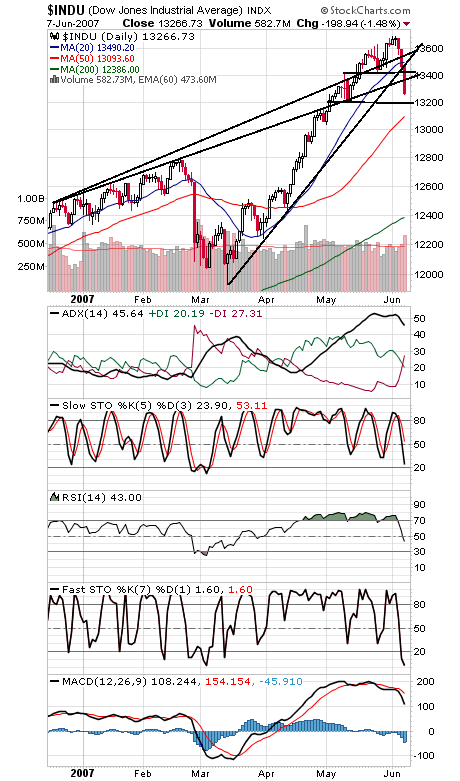
All-time highs continue to be a big problem for the market, whether it’s the Dow, Wilshire or S&P — all three have now caused significant pullbacks in the market in the last year. The S&P doesn’t have too much time left before the weakest months of the year, so if it can’t clear 1527.46-1552.87 with conviction in the next month or two, we could be in for another “Fall fall.” We don’t think that time is here yet, though, and we’ll cite rising fear indicators such as a spiking options volatility index (first chart) and the Nasdaq’s pending buy signal under Gerald Appel’s Nasdaq-NYSE relative strength ratio, which would become effective at tomorrow’s close if it holds (charts two and three). Perhaps most importantly, the selling reached extremes today, with 90% downside breadth and volume on the NYSE. If we can get the reverse of that within the next few days, the correction may have run its course.
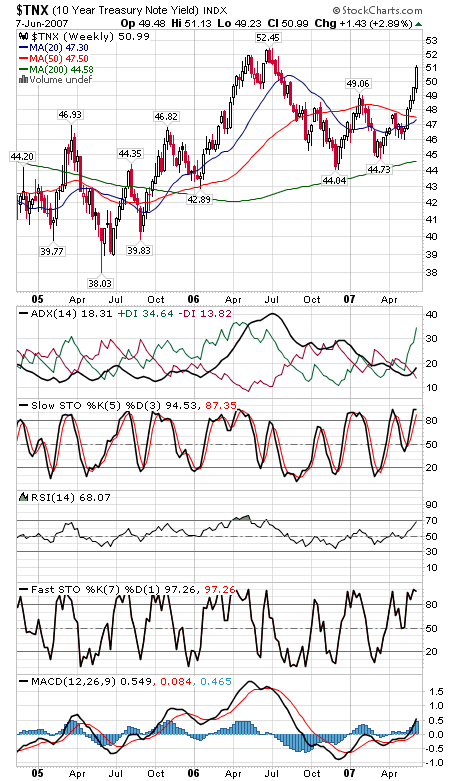
The Nasdaq has significant support at about 2532, with 2500 below that, and resistance is 2555, 2570 and 2581. The S&P (fourth chart) has support at 1487 and 1477, and resistance is 1500, 1506 and 1512-1514. The Dow (fifth chart) lost a whole lot of support today. Next up is 13,200 and 13,100, and resistance is 13,370, 13,424, 13,500 and 13,560. The 10-year yield (sixth chart) continues to price out rate cuts; above last summer’s highs and it will begin to price in rate hikes.
Paul Shread is a Chartered Market Technician (CMT) and member of the Market Technicians Association
