September is off to a good start if it is intent on keeping its century-old record as the worst month for stocks.
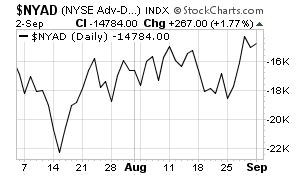
But don’t write off the month just yet. Exhibit A (first chart below) in the bullish case is the NYSE advance-decline line, which hit a new high last week with no help from any of the major indexes. That kind of broad support is the best hope for avoiding a sell-off this month; it’s hard to get a major decline without the broad list leading the way.
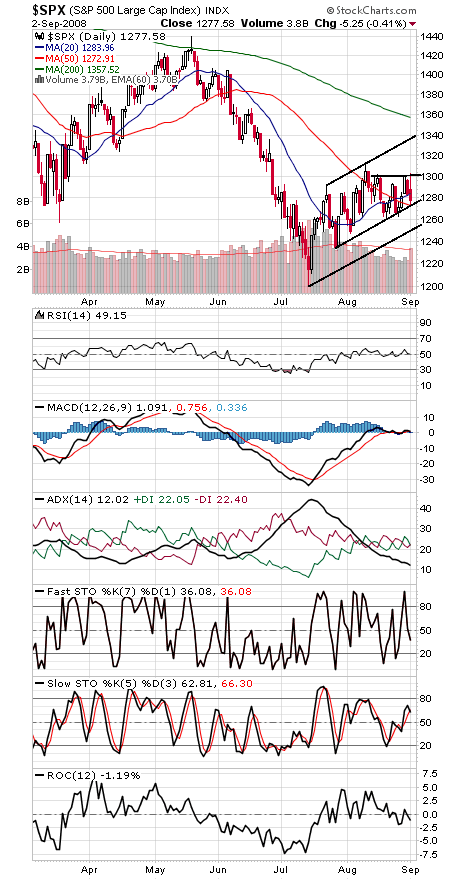
The S&P (second chart) is barely holding onto a rising support line at about 1273; if that goes, 1252 looks possible to the downside. To the upside, a strong break of 1300 could give the index upside potential to 1340. The Dow (third chart) has equally important support at about 11,440.
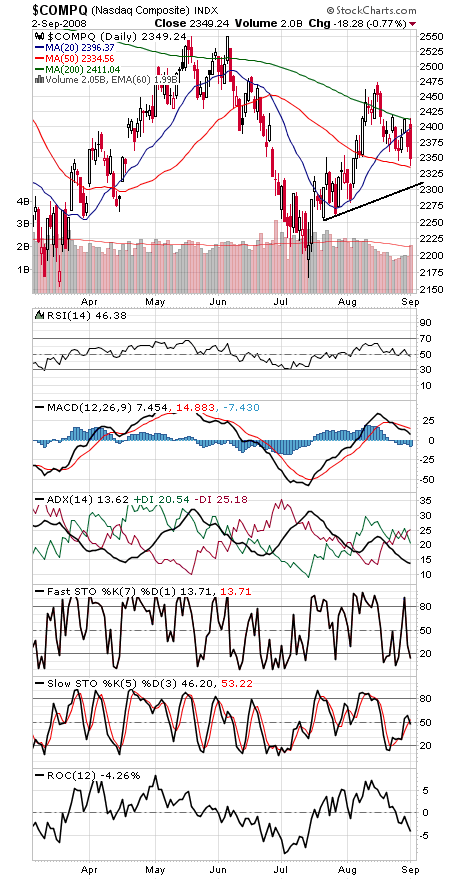
The Nasdaq (fourth chart), meanwhile, is stuck between its 200- and 50-day averages here — and nearly touched both today. A lot of volatility there.
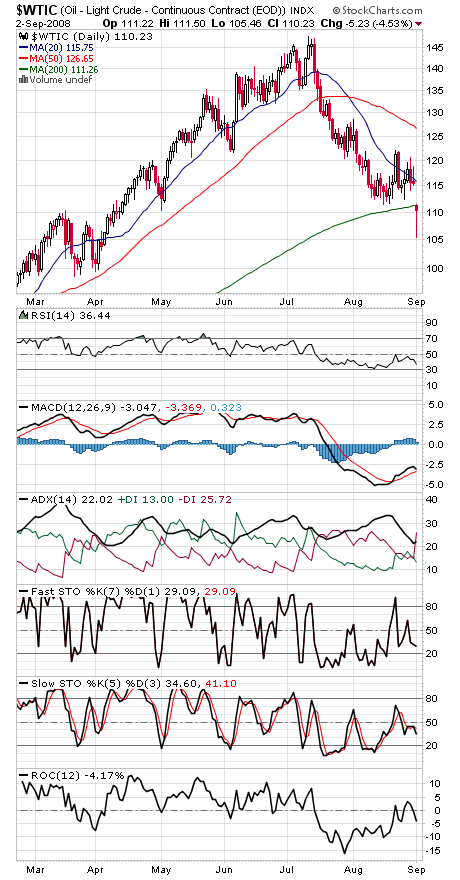
And finally, a look at oil (fifth chart), which had a big breakdown below its 200-day average today — and then nearly recovered. One to keep an eye on.
Paul Shread is a Chartered Market Technician (CMT) and member of the Market Technicians Association.