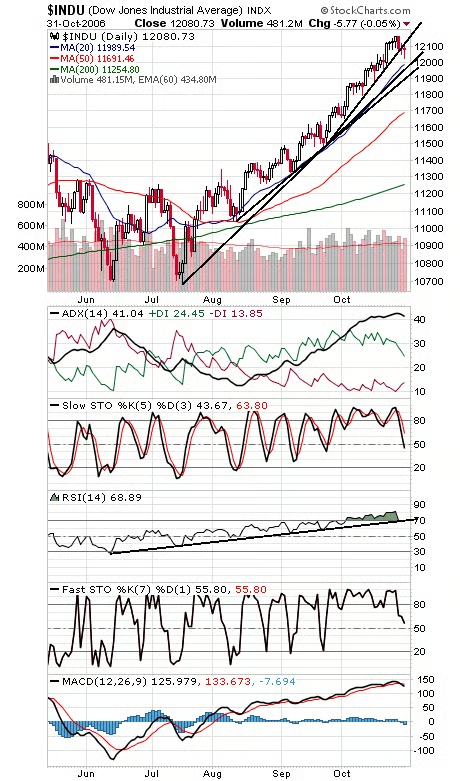
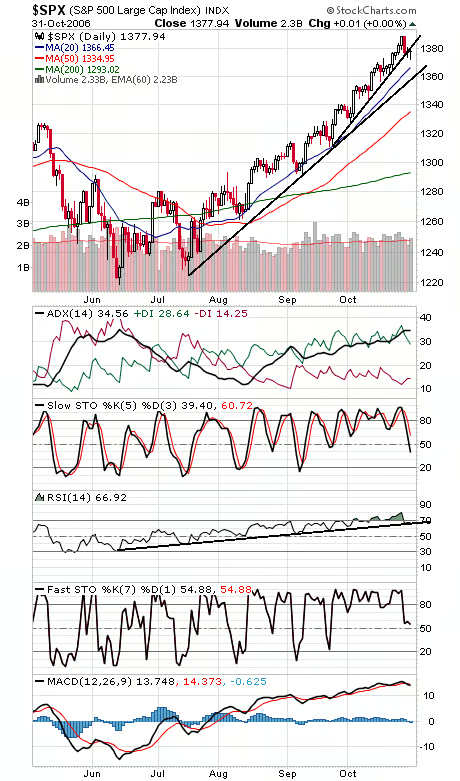
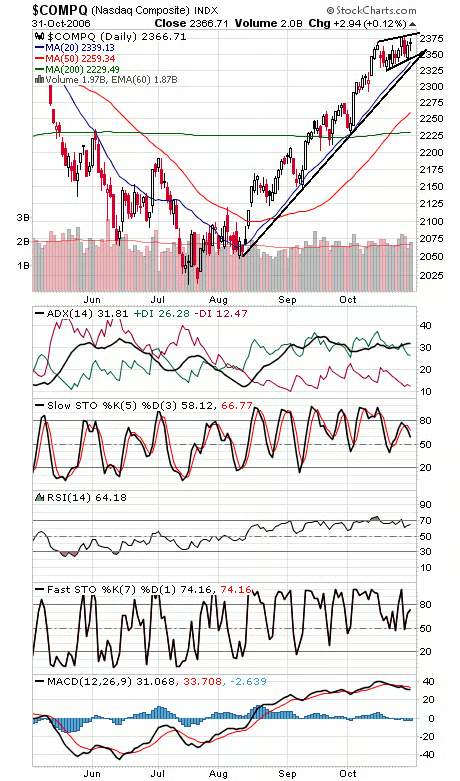
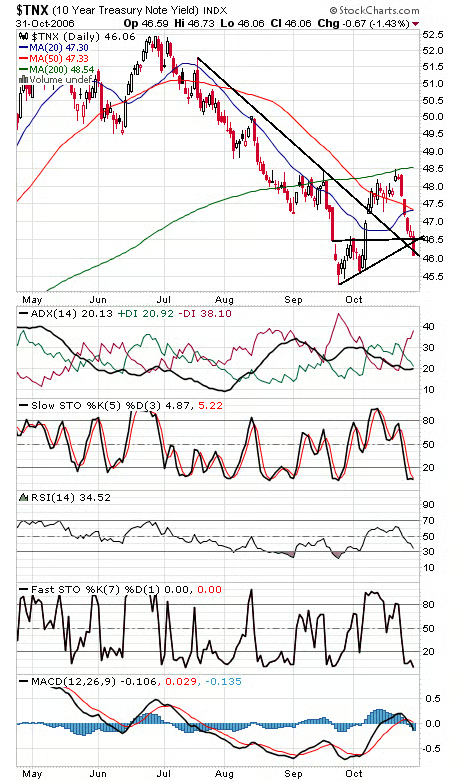
So far, sellers haven’t put much of a dent in the market, with the indexes still quite some distance from major support levels, and first-of-the-month inflows and strong seasonality should provide additional support going forward. Sentiment remains a mixed picture, with some advisory surveys showing a little excess, but options indicators still quite restrained. Still, we wouldn’t be surprised to see the market put in a significant top late this year or early next, in keeping with a common pattern of recent years. For now, the trend can be considered up until significant support levels begin to give. Those levels are 11,980-12,000 and 11,920 on the Dow (first chart below), 1360 on the S&P (second chart) and 2335 on the Nasdaq (third chart). We should note that the Dow and S&P have now given up their September uptrends, so a test of the main July/August uptrend lines is now more likely. First support levels on the S&P are 1372 and 1368. The Nasdaq remains in a choppy range here between 1347 and 1382. Bond yields (fourth chart) blasted through support today and appear headed for another leg down, Friday’s jobs report willing.