Technical Analysis: So Close | Internet News

Technical Analysis: So Close

Written By
Paul Shread
Paul Shread
Nov 1, 2005
1 minute read


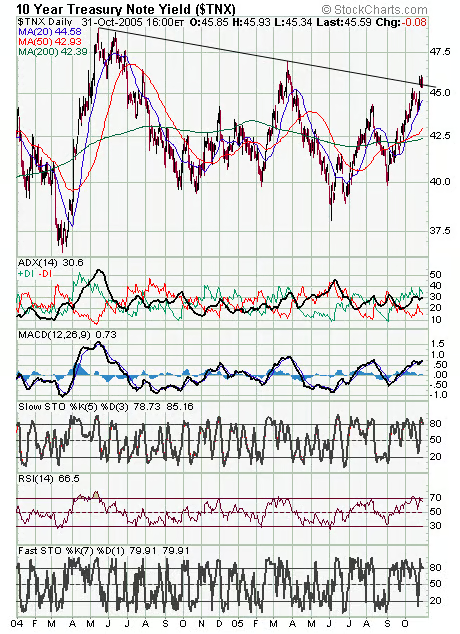
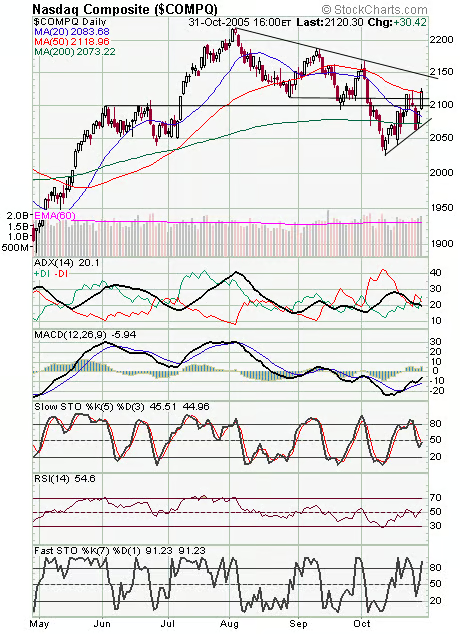
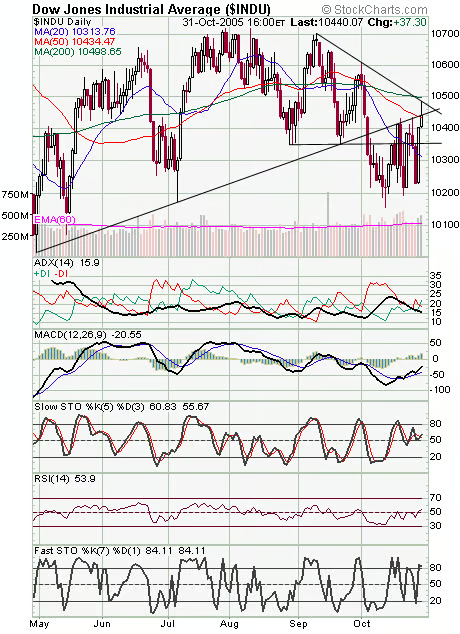
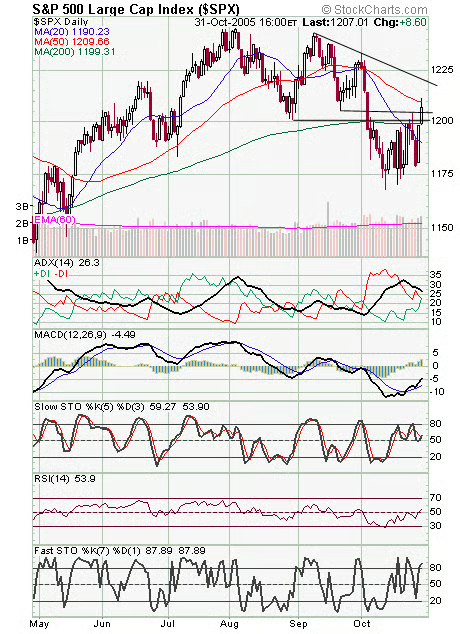
The markets came very close to bullish back-to-back 80% upside volume days today — last seen at the October 2002 low — but the late pullback prevented that from happening, and then Dell warned after the bell. Once again, we return to long-term interest rates (first chart below), which usually lead stocks, and they have yet to turn lower here. It will be hard for stocks to begin a major bull run without the support of lower interest rates. The Nasdaq (second chart) put in the strongest performance today. The index faces major resistance at 2145, and 2110, 2100, 2090-2094 and 2073 are support. The Dow (third chart) is pushing major resistance between here and 10,500, with 10,480 a big number if the index can turn up tomorrow. Support is 10,400 and 10,350. The S&P (fourth chart) faces resistance at 1210 and 1220, and 1205 and 1199-1201 are now support.


Internet News Logo

InternetNews is a source of industry news and intelligence for IT professionals from all branches of the technology world. InternetNews focuses on helping professionals grow their knowledge base and authority in their field with the top news and trends in Software, IT Management, Networking & Communications, and Small Business.

Property of TechnologyAdvice. © 2026 TechnologyAdvice. All Rights Reserved

Advertiser Disclosure: Some of the products that appear on this site are from companies from which TechnologyAdvice receives compensation. This compensation may impact how and where products appear on this site including, for example, the order in which they appear. TechnologyAdvice does not include all companies or all types of products available in the marketplace.