Note: The Market Close and Technical Analysis columns will be on hiatus next week and will return June 30.
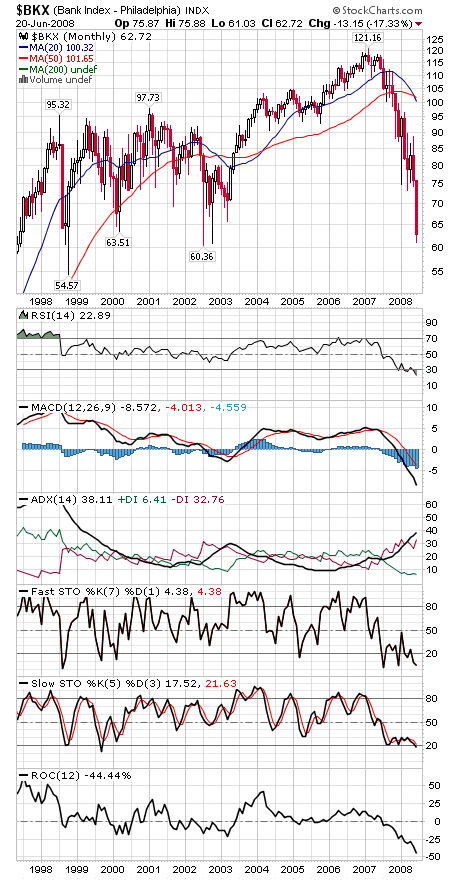
The bank stocks started this decline — and with any luck, they’ll end it soon.
The bank sector (first chart below) is coming up on a very important support area, its 2002 and 1998 lows. The market should be able to find some support there — and it’s interesting to note that the BKX put in a higher low today than it did yesterday and finished well off its lows, a small positive divergence if the bulls can seize on it.
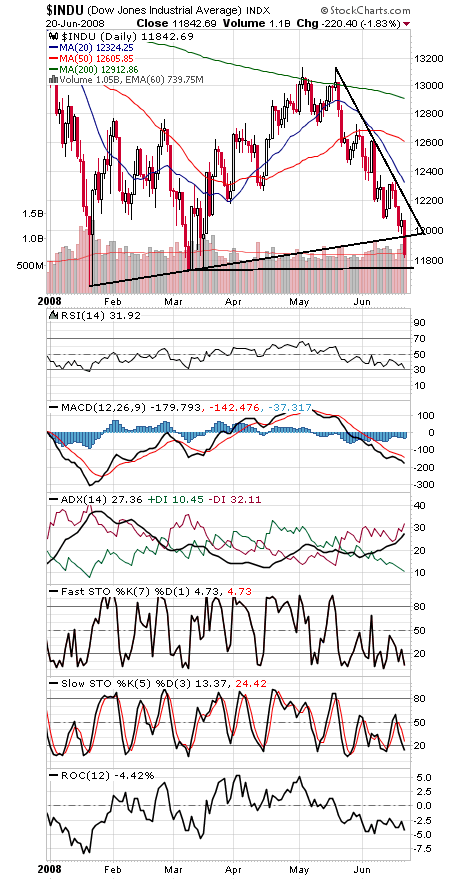
The Dow (second chart) needs to hold its March closing low of 11,740. Below that, 11,634 was its January intraday low, and then 11,500 and 11,400 come into play. To the upside, 11,960-12,000 and a sharp downtrend line at 12,160 and falling are resistance.
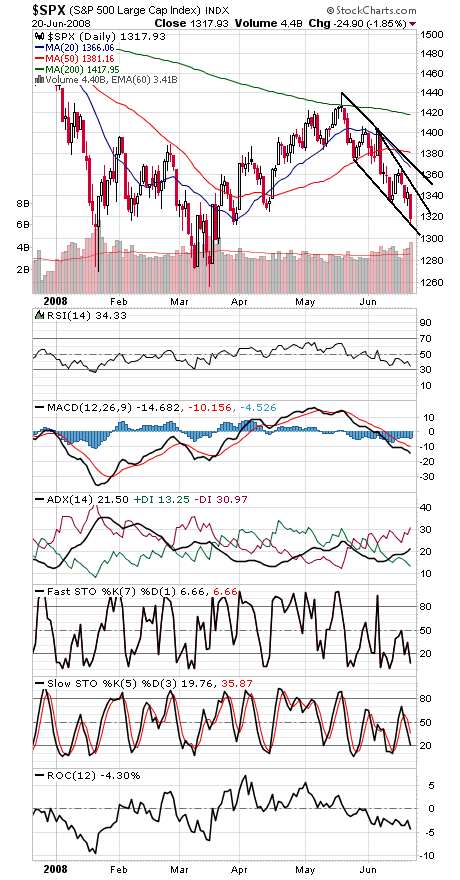
The S&P (third chart) has a falling support line, at 1306 and falling on Monday, while resistance is a couple of falling downtrend lines, at 1347 and 1367 for Monday. Below 1306, there is cluster of support down to 1270.
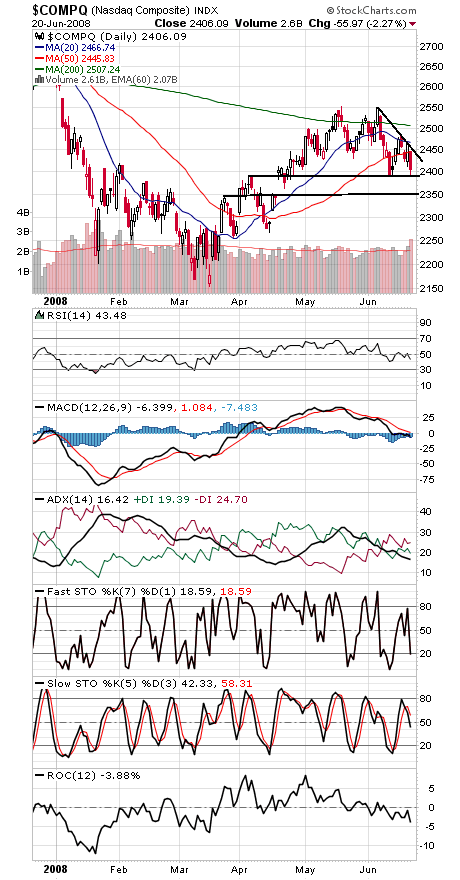
The Nasdaq (fourth chart) was the only one of the “Big Three” not to set a new low today. Support is 2387-2392 and 2350, and 2445 is resistance, a falling downtrend line and the 50-day average.
Paul Shread is a Chartered Market Technician (CMT) and member of the Market Technicians Association.