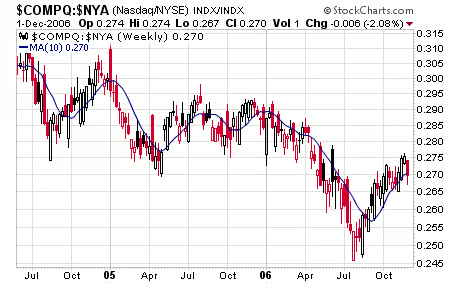
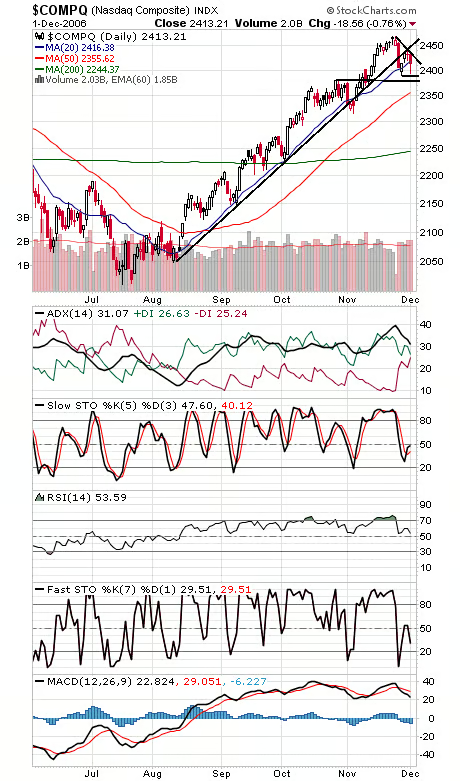
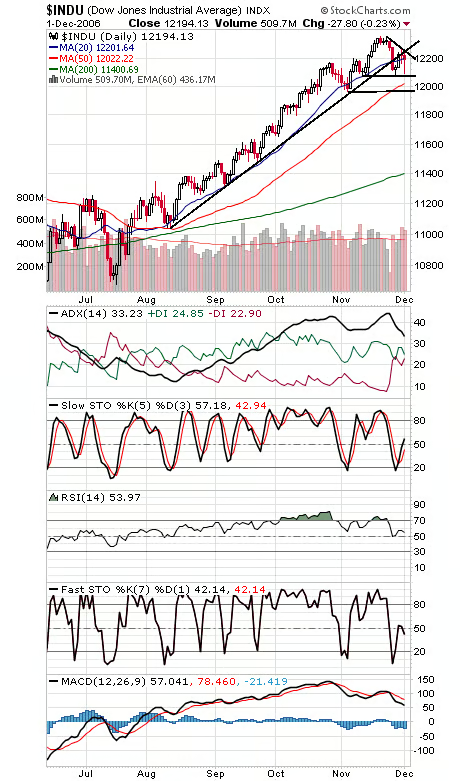
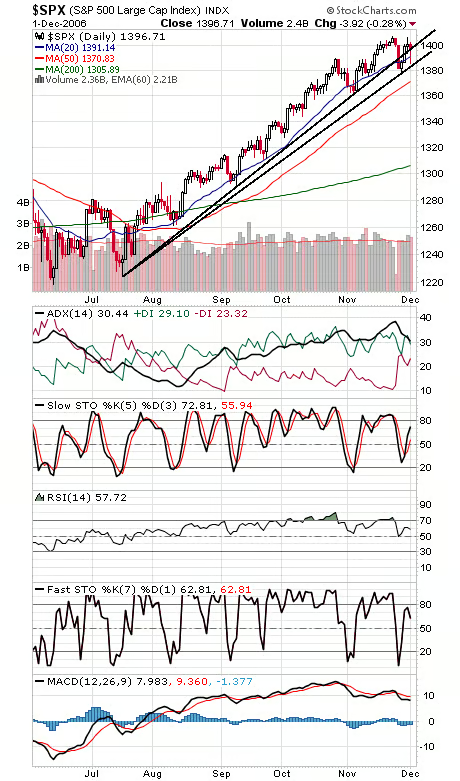
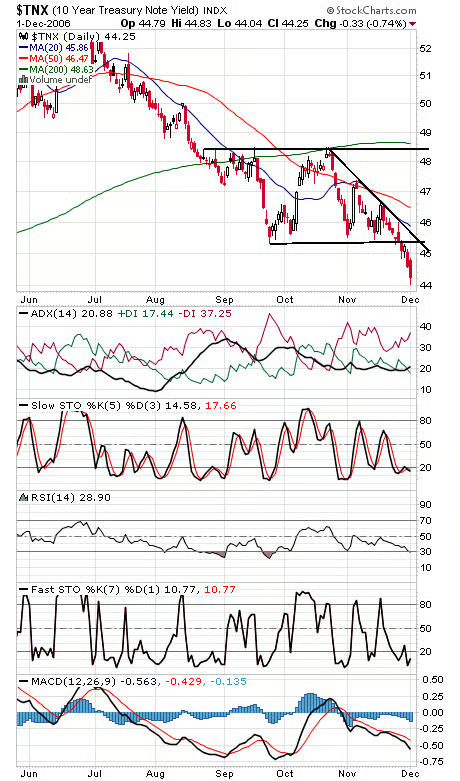
It was touch and go, but the indexes held some important levels on Friday, not the least of which was the Nasdaq just barely hanging onto its buy signal from early September (see first chart below). That said, the market’s action has undeniably turned a little wobbly here and options behavior hasn’t been as panicky as it has on other pullbacks, so the rally appears to be vulnerable for the first time. Still, as long as the early November lows hold, the big picture remains one of higher highs and higher lows, the basic definition of an uptrend. The Nasdaq (second chart) faces important resistance at 2430 and 2455, and support is 2390 and 2380. The Dow (third chart) also looks a little wobbly here, failing at its old uptrend line today. Resistance is 12,240 and 12,275, and support is 12,072. The S&P (fourth chart) is the one index that looks constructive here. 1385 is support, and resistance is 1408 and 1414-1426. Long bond yields (fifth chart) could be headed for 4.25%, based on the three-point pattern yields broke down out of recently. That would price in four Fed rate cuts.