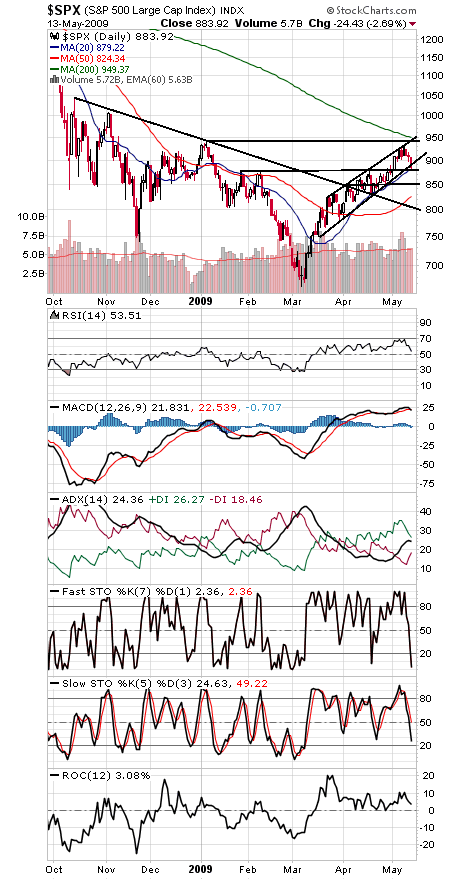
The S&P (first chart below) couldn’t quite make it to the critical resistance zone of 944-950 before turning lower. That remains the level to beat if this rally is going to have staying power.
The index also took out the lower boundary of a rising channel today, putting it in some danger of a deeper pullback. 875-878 is an important next support level, with 850 and 833 coming into play if that goes.
To the upside, a move back above 895-900 would get the index back inside that channel, and 930 is the next hurdle above that.
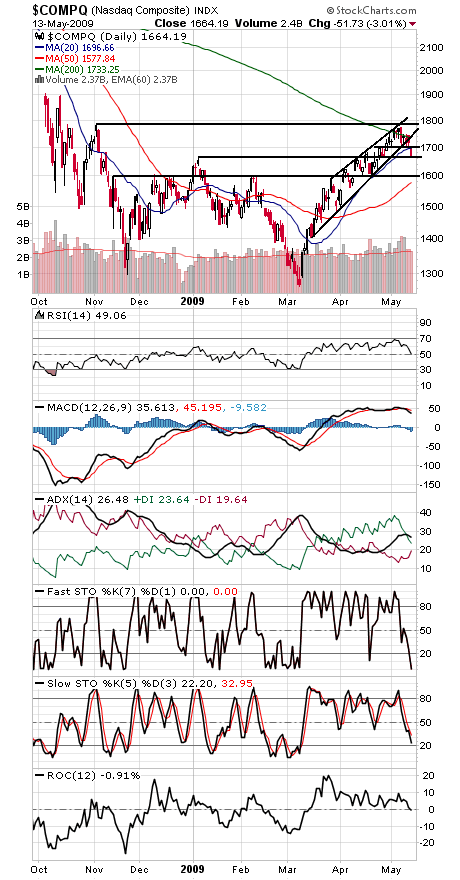
The Nasdaq (second chart) is also breaking below support here. The index closed just under 1665 support today; the next big support level looks like 1600, with the 50-day average just below that. To the upside, 1700, the 200-day average at 1733 (and falling) and 1773-1785 are the levels to beat.
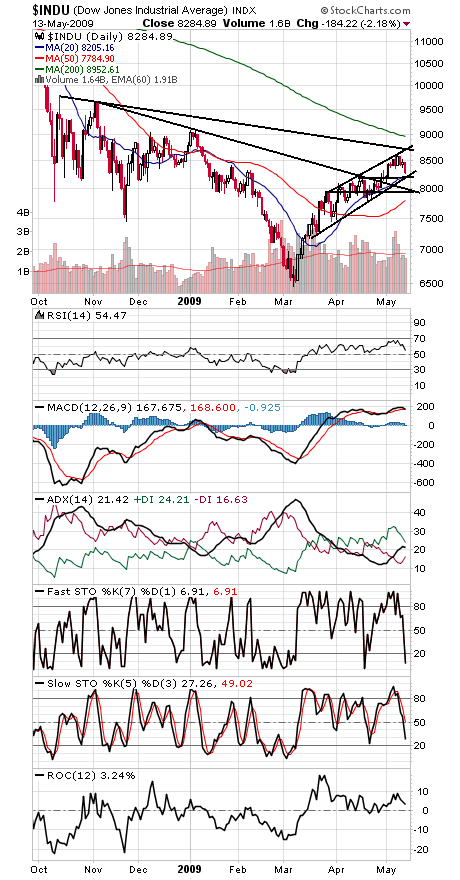
The Dow (third chart) has support at 8200, 8000 and 7930, and resistance is 8587 and 8700.
In short, after struggling unsuccessfully with major resistance, the market has turned vulnerable here — and the MACD sell signals in those charts below could signal the arrival of the weakest part of the year.
Paul Shread is a Chartered Market Technician (CMT) and member of the Market Technicians Association. He is a co-author of the book “Dow Theory Unplugged” from W&A Publishing.


