Technical Analysis: S&P Faces Rejection | Internet News

Technical Analysis: S&P Faces Rejection

Written By
Paul Shread
Paul Shread
Feb 11, 2009
1 minute read

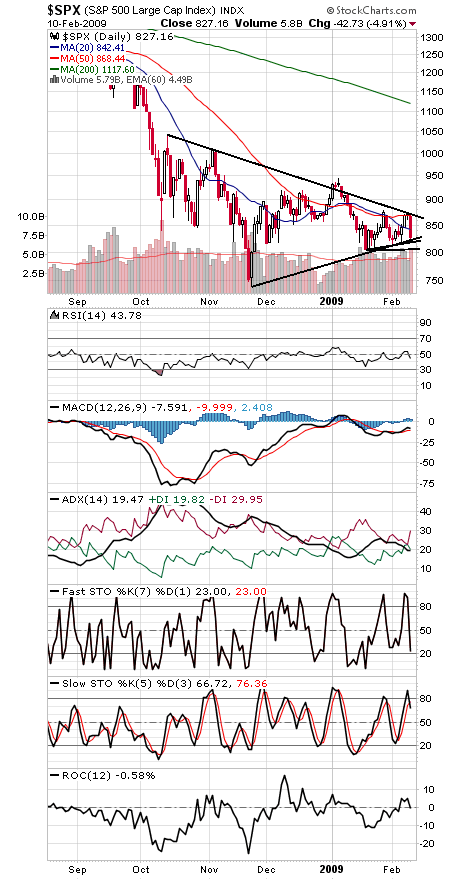
The S&P 500 (first chart below) spent all of a day at the major resistance level of 868-878 before failing, turning sharply lower today.

That remains the level to beat to the upside, while 820-823 and 804 need to hold to the downside or the stock market could be starting another wave down here.

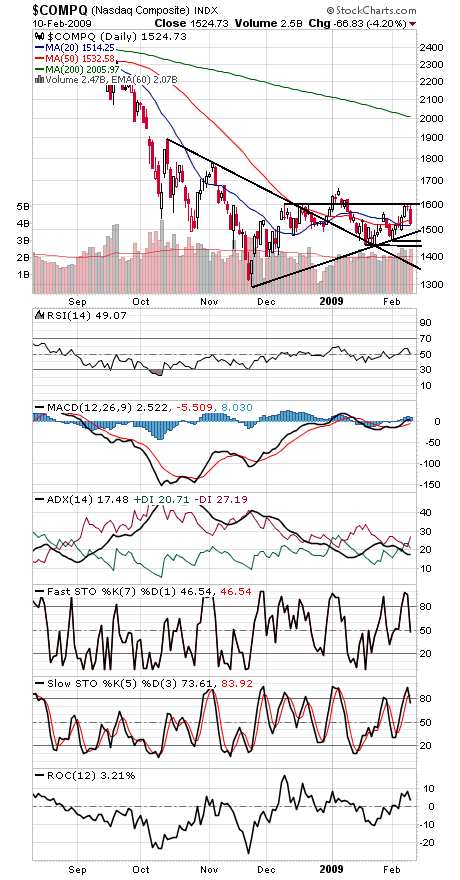
Ideal support for the Nasdaq (second chart) is 1490; below that, 1460 and 1434 are the next support levels. To the upside, 1600-1604 is once again a tough hurdle.

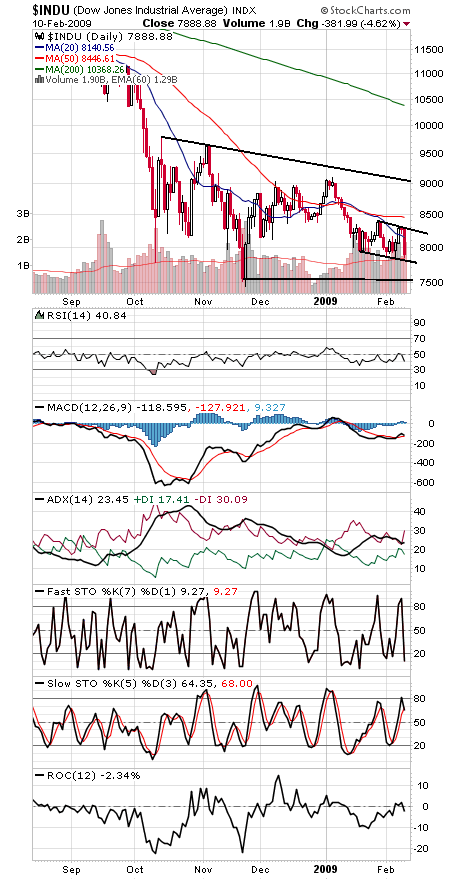
The Dow (third chart) needs to hold 7800 or its November closing low of 7552.29 could come into play. To the upside, the index must clear 8400-8500.

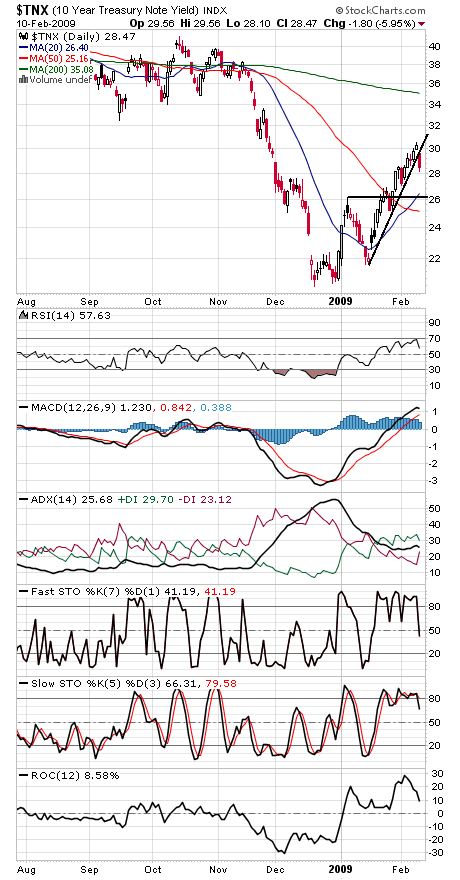
Treasury yields (fourth chart) also turned sharply lower today, a negative development for the reflation trade.

Paul Shread is a Chartered Market Technician (CMT) and member of the Market Technicians Association.

Internet News Logo

InternetNews is a source of industry news and intelligence for IT professionals from all branches of the technology world. InternetNews focuses on helping professionals grow their knowledge base and authority in their field with the top news and trends in Software, IT Management, Networking & Communications, and Small Business.

Property of TechnologyAdvice. © 2026 TechnologyAdvice. All Rights Reserved

Advertiser Disclosure: Some of the products that appear on this site are from companies from which TechnologyAdvice receives compensation. This compensation may impact how and where products appear on this site including, for example, the order in which they appear. TechnologyAdvice does not include all companies or all types of products available in the marketplace.