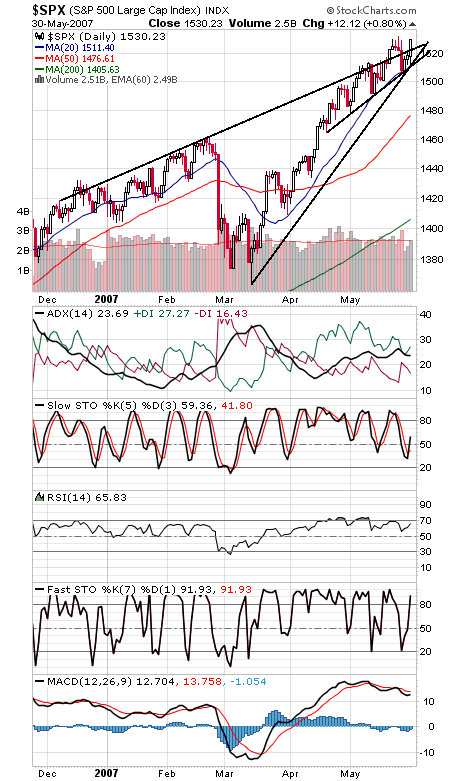
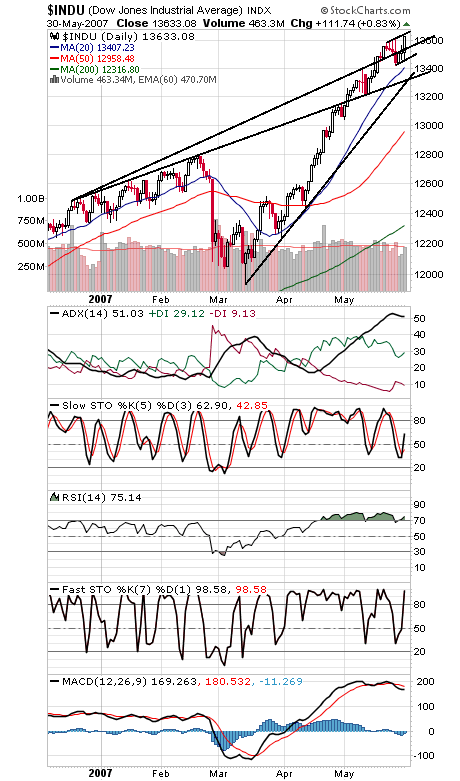
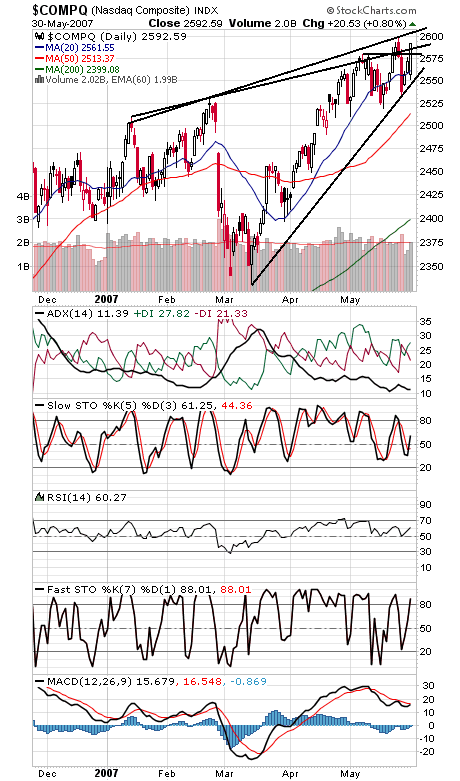
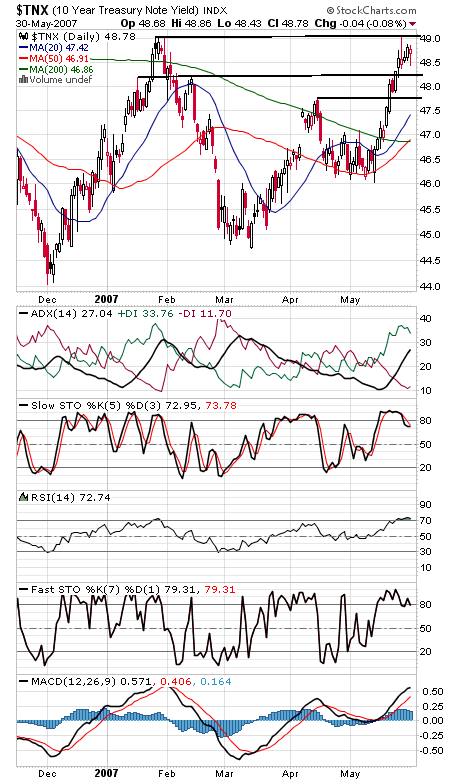
The S&P (first chart below) finally cleared its previous all-time closing high of 1527.46, but the intraday mark of 1552.87 still remains. If the index can clear that level, it could be off to the races, particularly with all the commercial buying in the big S&P and Nasdaq futures contracts. But this remains a dicey area for the market, a place where a sharp pullback could easily occur. Still, between sentiment and seasonality, the market backdrop should remain positive for the next couple of months. 1532.43 is first resistance on the S&P, and support is 1524 and 1512-1515. The Dow (second chart) has resistance at about 13,650, and support is 13,560, 13,500 and 13,470. The Nasdaq (third chart) has tough resistance at 2605, and support is 2587 and 2576-2581. The 10-year yield (fourth chart) is pausing at 4.9%-5.0% resistance.
Paul Shread is a Chartered Market Technician (CMT) and member of the Market Technicians Association