SHARE
Facebook X Pinterest WhatsApp

Technical Analysis: S&P Hits Headwinds

Written By
thumbnail
Paul Shread
Paul Shread
Dec 15, 2005

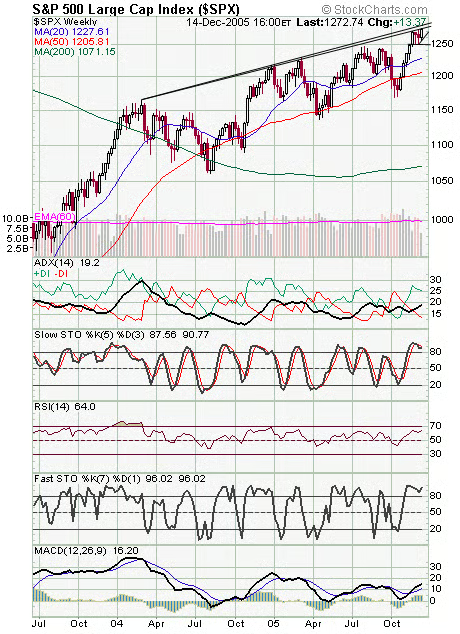
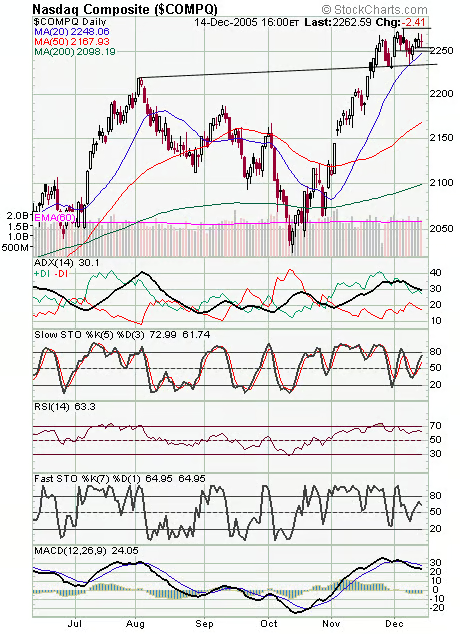
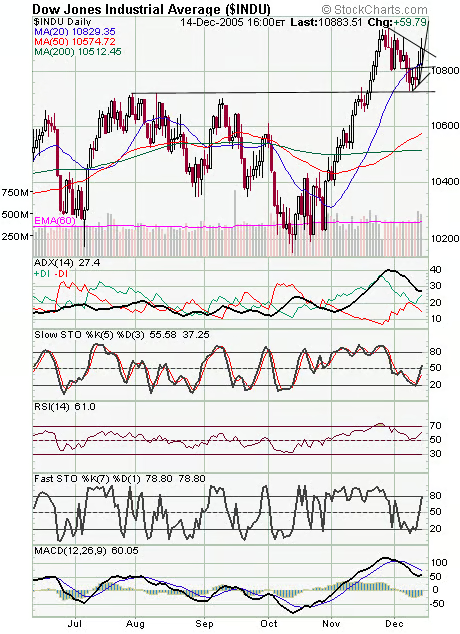
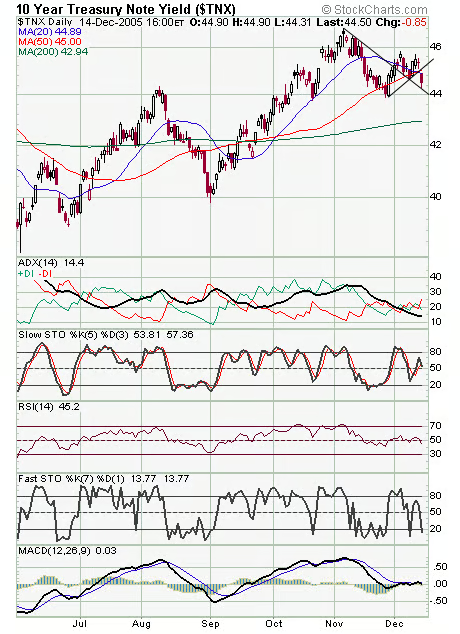
The S&P (first chart below) is once again running into a trendline that has halted rallies since early 2004. That makes 1276-1280 or so very tough resistance for the index. Support is 1265, 1260 and 1250. The Nasdaq (second chart) still needs to clear its recent high at 2278 to avoid looking toppy here. Support is 2254, 2250 and 2234. The Dow (third chart) is faring somewhat better today. Resistance remains 10,950-11,000, and support is 10,820 and 10,720-10,750. Long bonds (fourth chart) put in a heck of a move today — finally something to cheer about there.


Recommended for you...

U.S. Needs to Protect Tech Leadership: Qualcomm
Rob Enderle
Apr 8, 2022
HP’s ExtendXR Service Gets an Early Lead on a Looming Metaverse Problem
Rob Enderle
Mar 5, 2022
Cisco’s Purpose Is to Improve the World. Imagine if Others Followed.
Rob Enderle
Dec 17, 2021
HP Builds an Advanced Cloud Workstation for the Metaverse
Rob Enderle
Nov 13, 2021
Internet News Logo

InternetNews is a source of industry news and intelligence for IT professionals from all branches of the technology world. InternetNews focuses on helping professionals grow their knowledge base and authority in their field with the top news and trends in Software, IT Management, Networking & Communications, and Small Business.

Property of TechnologyAdvice. © 2025 TechnologyAdvice. All Rights Reserved

Advertiser Disclosure: Some of the products that appear on this site are from companies from which TechnologyAdvice receives compensation. This compensation may impact how and where products appear on this site including, for example, the order in which they appear. TechnologyAdvice does not include all companies or all types of products available in the marketplace.