It’s been two weeks since we noted that stock indexes were facing major resistance here — and two weeks later, they’re still struggling with this important zone.
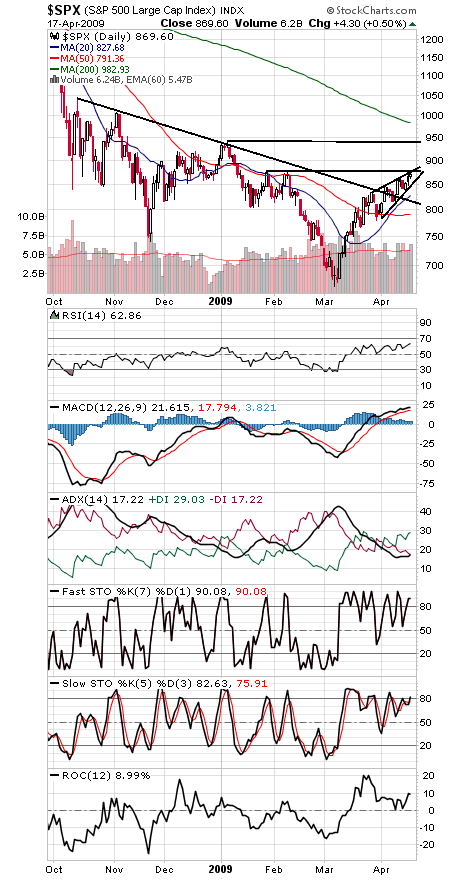
The S&P (first chart below) has become choppy and overlapping as it hits 878 resistance. With bullish sentiment rising, it seems like a good place to look for a pause. 855-860 is first support, with 830, 815 and 804 below that. If the bulls can push higher with some force, the rally has room to 944.
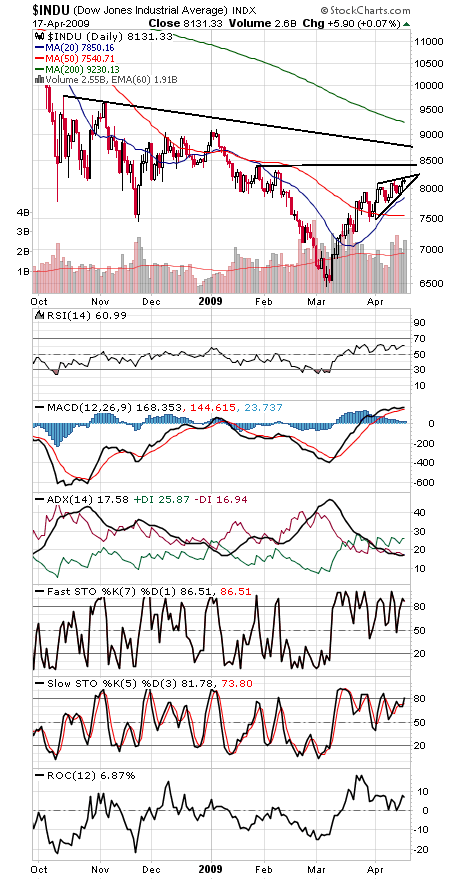
The Dow (second chart) won’t hit similar resistance until 8405. Support is 8000-8050, 7850-7900, and 7540-7571.
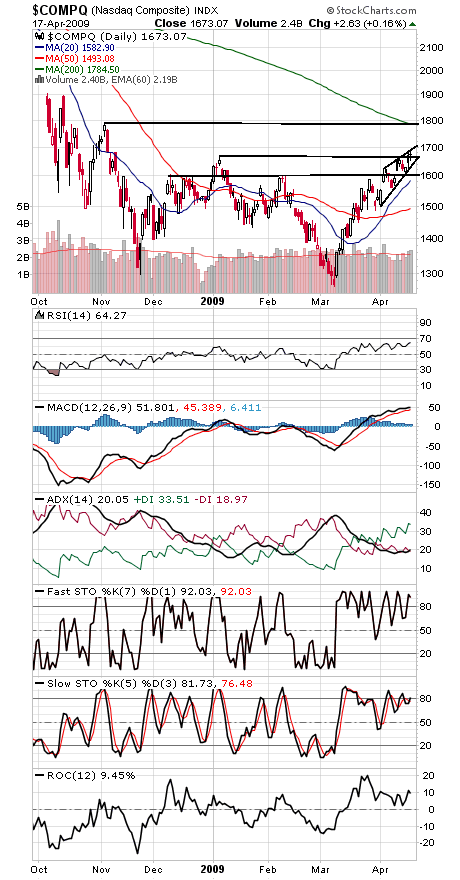
The Nasdaq (third chart) has been the real powerhouse, hitting its highest level since November. If it can get through 1700, it could be head for 1785. Support is 1665, 1650 and 1600.
The stock market has come a long way without a significant break and is looking a little tired here. How it handles the first big pullback will be the real test of the rally’s staying power.
Paul Shread is a Chartered Market Technician (CMT) and member of the Market Technicians Association. He is a co-author of the book “Dow Theory Unplugged” from W&A Publishing.


