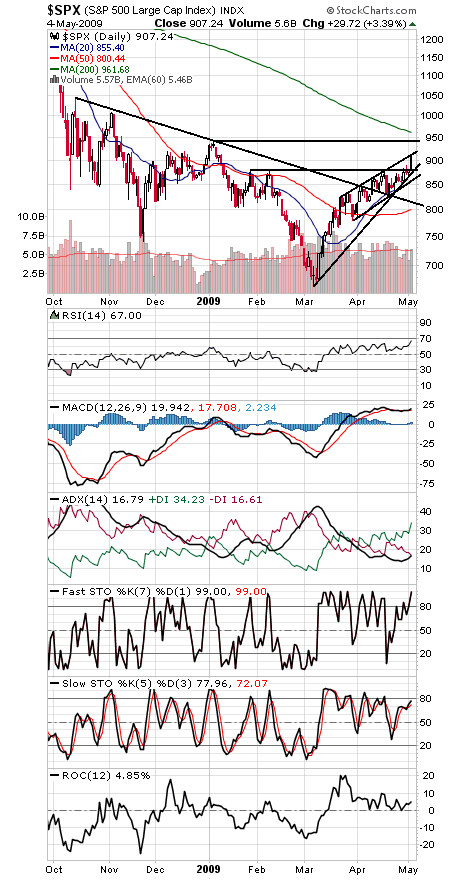
The S&P (first chart below) is hitting a rising resistance line here that has marked the rally’s upper boundary since mid-March.
That could make this a good spot for a pullback. If the index can power higher by more than the few points a day that that line is rising (it will be at about 913 tomorrow), then the index could be headed for the even tougher resistance zone of 944-961, which includes the early January high and the simple and exponential 200-day moving averages.
To the downside, 878 is important first support, with 860 below that.
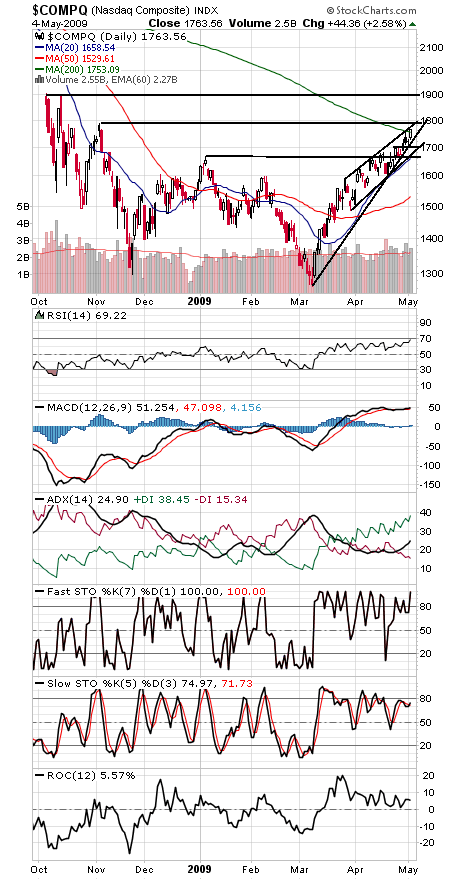
The Nasdaq (second chart) has been making a mockery of resistance. If it can get through 1785, it could be headed for that big gap at 1900 from October. Support is 1753, 1735 (and rising) and 1680.
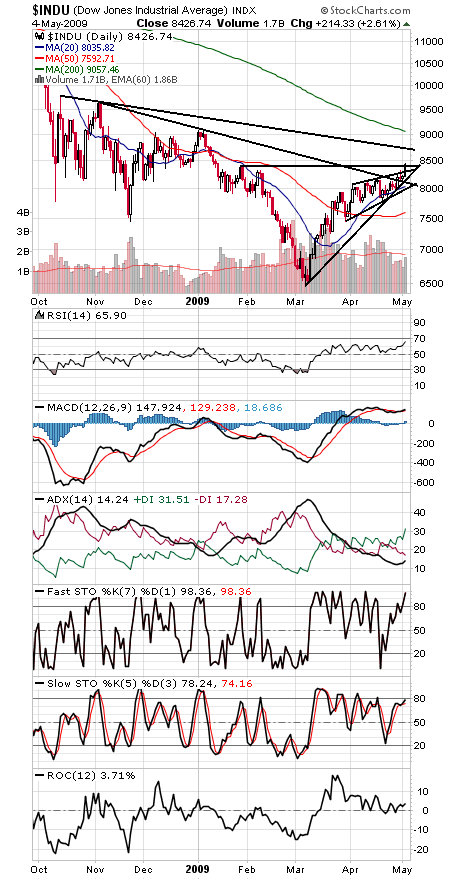
The Dow (third chart) faces a tough hurdle at 8700, with 9088 the next big level above that. The index has support at 8300, 8200, 8100 and 8000.
In short, the stock market is nearing a zone where it seems reasonable to expect a pullback, perhaps the first significant one since the rally began. How the market handles the next 4-6% will say a lot about the health of the rally — and the economy in general.
Paul Shread is a Chartered Market Technician (CMT) and member of the Market Technicians Association. He is a co-author of the book “Dow Theory Unplugged” from W&A Publishing.