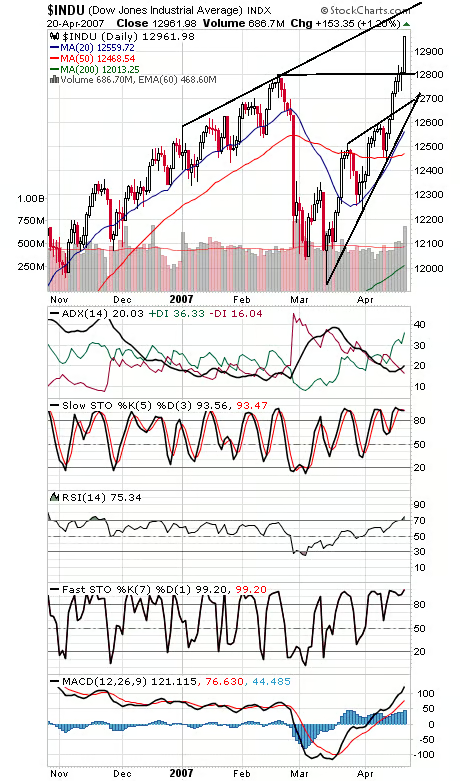
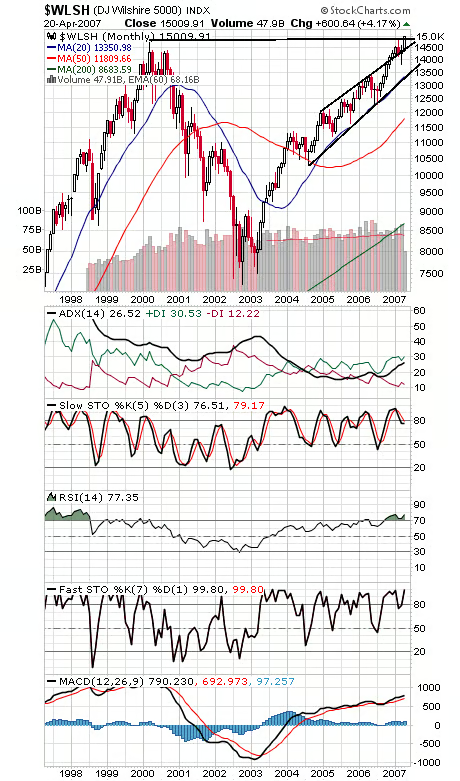
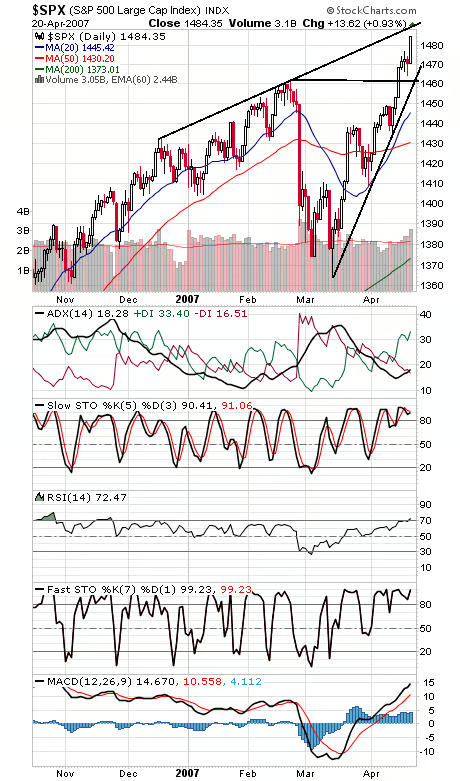
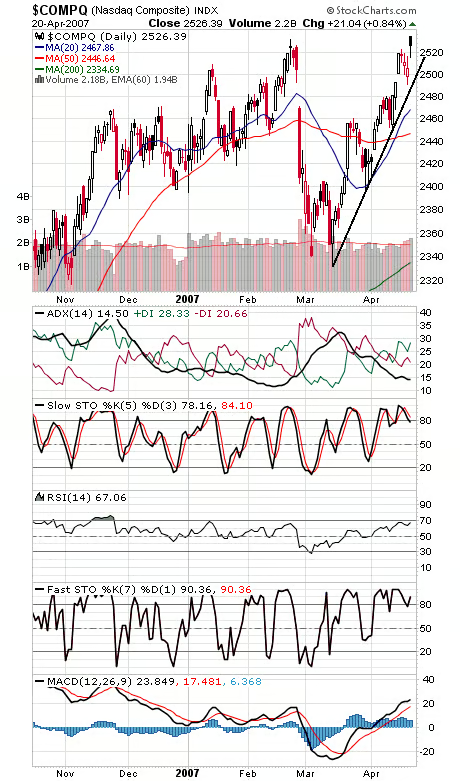
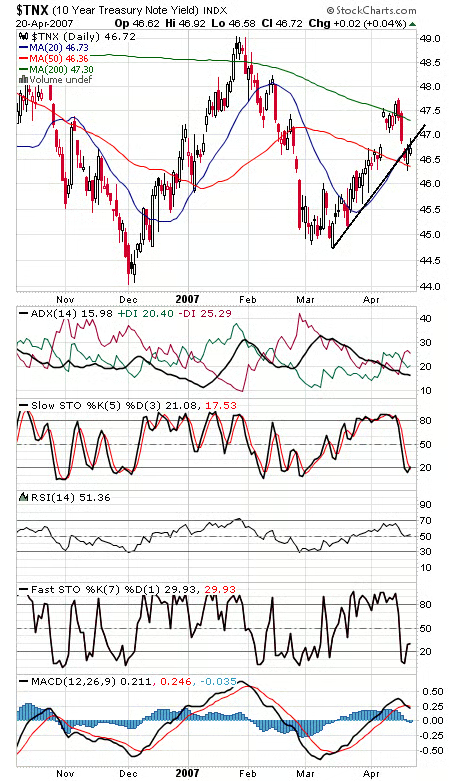
With the Dow and Wilshire 5000 (first two charts below) hitting new all-time highs here, can the S&P (third chart) be far behind? A number of factors could come into play here, not the least of which is that stocks are pretty extended and could use a break, and options traders turned a little complacent today. Another issue is whether investors — remembering last year’s sell-off as the Dow approached its all-time high — could turn jittery here. In a positive vein, cycles and seasonality remain positive for a few more months, so the S&P could get the job done in the next few months. A lot of crosscurrents at work here. In the short term, a pullback to the recent breakout points of 12,800 on the Dow and 1461 on the S&P seems like a good bet at some point. The S&P could hit resistance just above 1490, and 13,000 is an obvious resistance level on the Dow. The Nasdaq (fourth chart) remains the laggard, as it has since November. Resistance is 2532 and 2550, and 2490-2500 is important support. Bond yields (fifth chart) continue to creep higher but are getting stymied by their old uptrend line.