Technical Analysis: S&P Pushes Resistance | Internet News

Technical Analysis: S&P Pushes Resistance

Written By
Paul Shread
Paul Shread
Apr 26, 2008
1 minute read

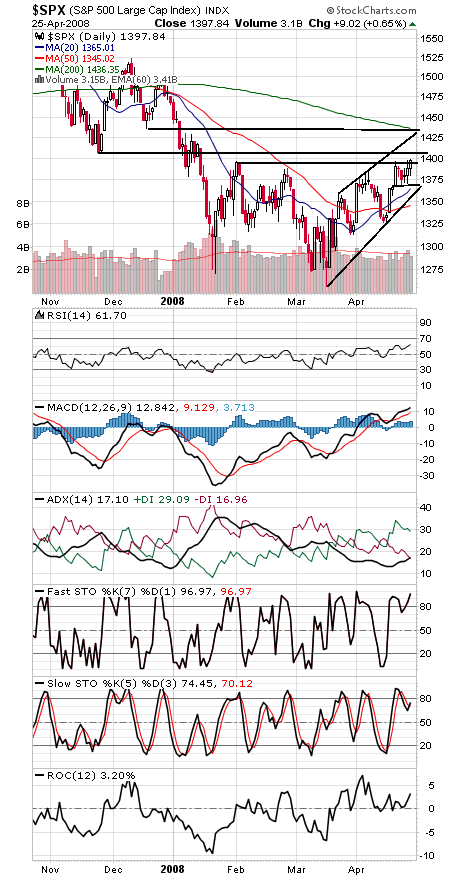
Bulls continue to push higher in the wake of the recent Dow Theory bull signal, with the S&P (first chart below) trying to break out of a multi-month trading range here.

Resistance on the S&P is 1406 and 1435, and support is 1370 and 1360.

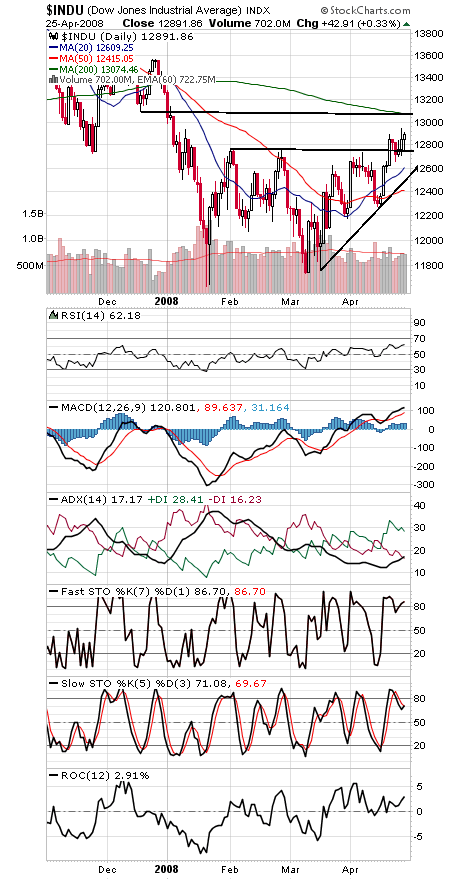
The Dow (second chart) has support at 12,743 and 12,530, and resistance is 13,000-13,100.

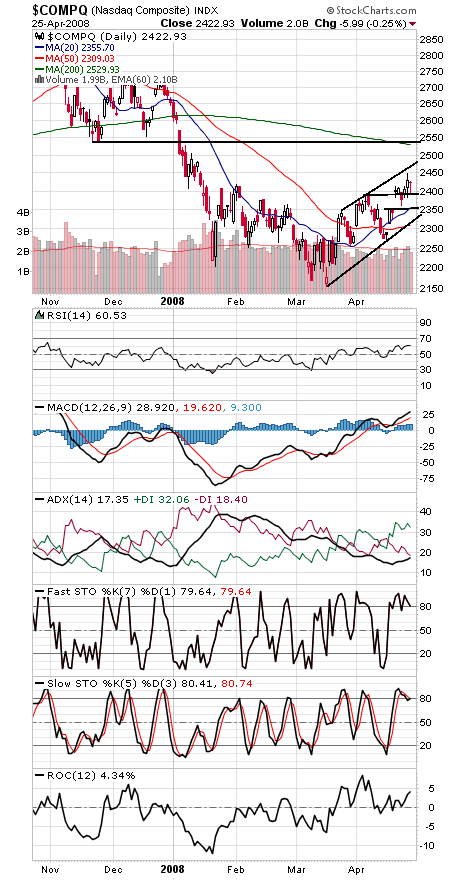
The Nasdaq (third chart) faces resistance at 2475, 2500 and 2530-2540, and support is 2391-2400, 2350 and 2330.

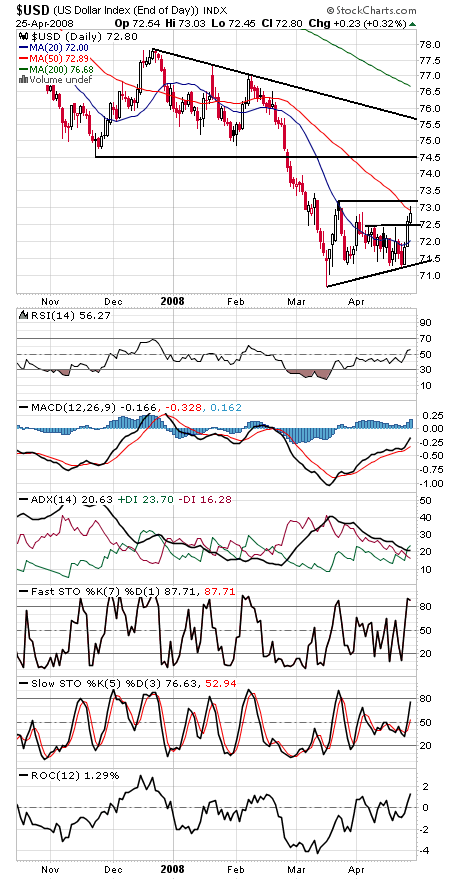
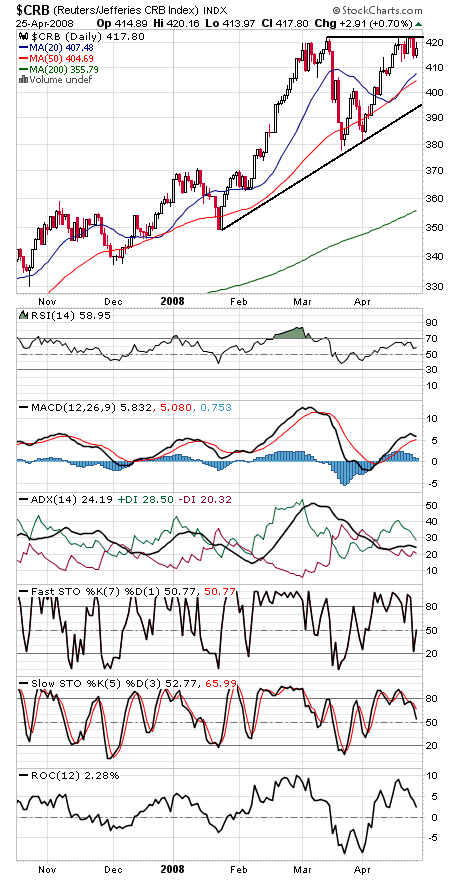
Finally, the dollar (fourth chart) is once again trying to bottom, but it hasn’t put much of a dent in commodity prices yet (fifth chart).

Paul Shread is a Chartered Market Technician (CMT) and member of the Market Technicians Association.

Internet News Logo

InternetNews is a source of industry news and intelligence for IT professionals from all branches of the technology world. InternetNews focuses on helping professionals grow their knowledge base and authority in their field with the top news and trends in Software, IT Management, Networking & Communications, and Small Business.

Property of TechnologyAdvice. © 2026 TechnologyAdvice. All Rights Reserved

Advertiser Disclosure: Some of the products that appear on this site are from companies from which TechnologyAdvice receives compensation. This compensation may impact how and where products appear on this site including, for example, the order in which they appear. TechnologyAdvice does not include all companies or all types of products available in the marketplace.