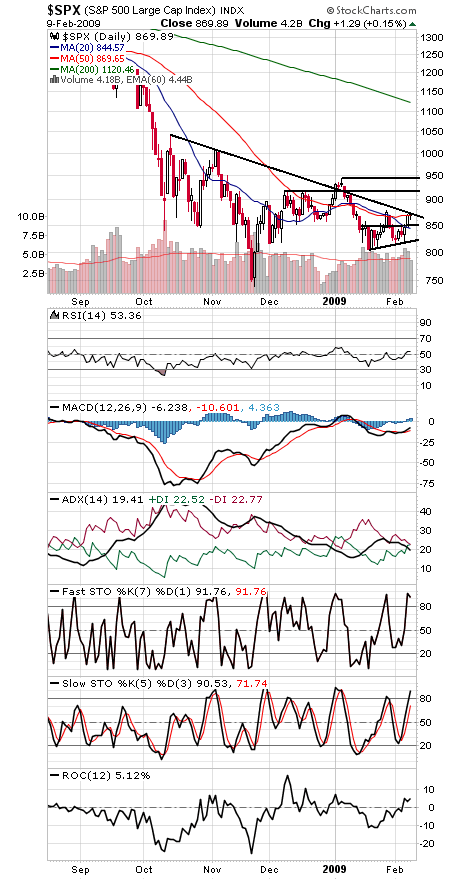
The S&P is sitting at major resistance here, but so far it’s hanging in there.
With both its 50-day average and a downtrend line from October here, it’s a pretty formidable resistance zone for the stock market. If the index can clear 878, the next levels to beat are 900, 918 and 944.
To the downside, 850 needs to hold or 800-820 could come back into play.
In the big picture, the index remains very much range-bound. A move above 944 could send the index above 1000, while a move below 804 could lead to a retest of the November lows.
Sentiment continues to be a negative for the bullish case. A ratio of 35 to 36 bulls to bears in the most recent Investors Intelligence weekly survey is hardly extreme, but since the ratio was 22 to 54 four months ago and stocks have barely budged since then, this trading range seems to be rebuilding bullish sentiment rather than instilling doubt. That could limit upside potential.
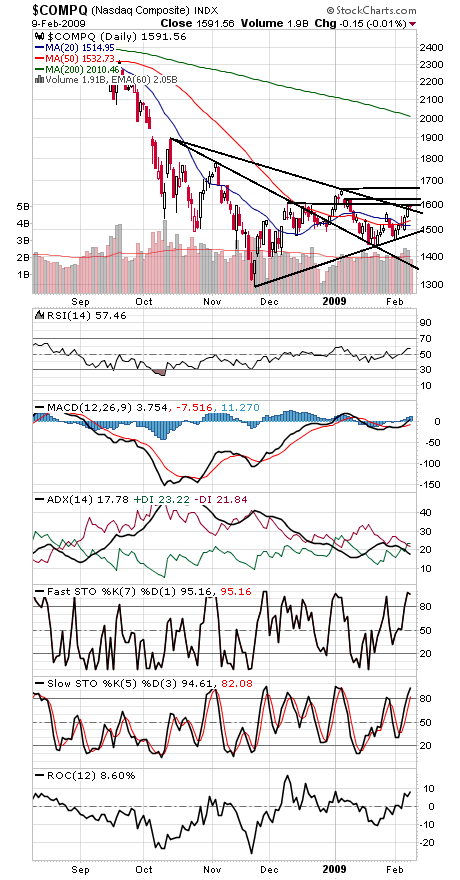
The Nasdaq (second chart) is a much stronger index lately, having long ago cleared and held the same line the S&P is now struggling with. 1604, 1617-1625 and 1652-1665 are resistance, and support is 1585, 1550, 1535 and 1515.
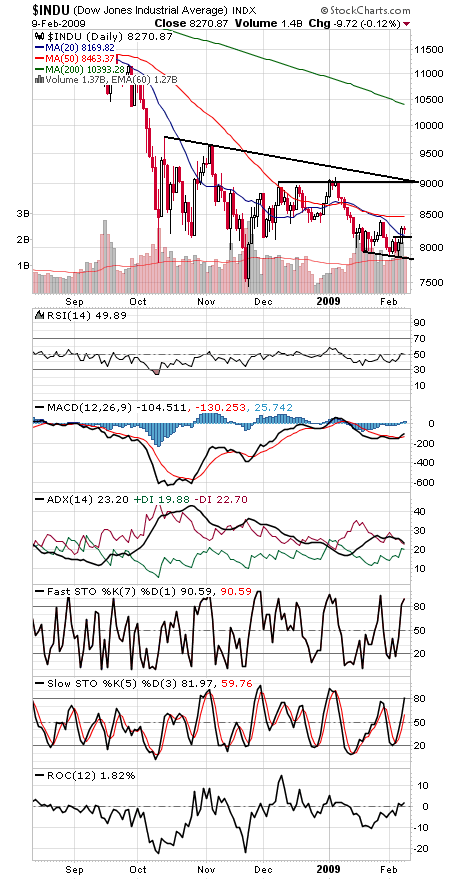
The Dow (third chart) is by far the weakest of the Big Three indexes; that same trendline is about 10% higher than here. 8500 is the first major resistance level, and support is 8162, 8000 and 7800.
Paul Shread is a Chartered Market Technician (CMT) and member of the Market Technicians Association.


