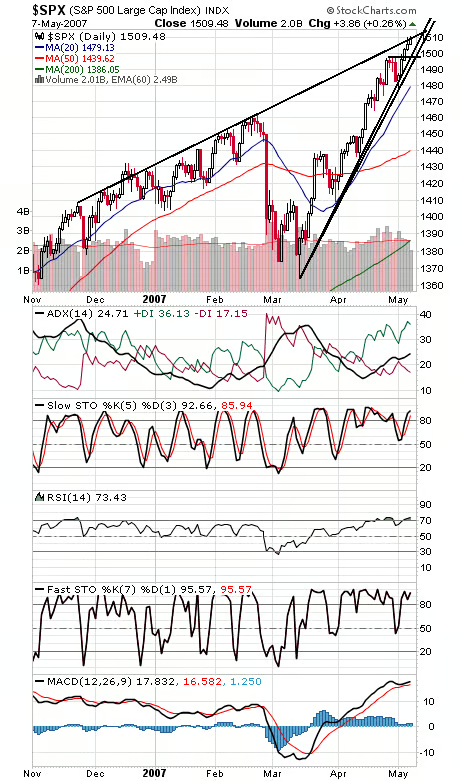
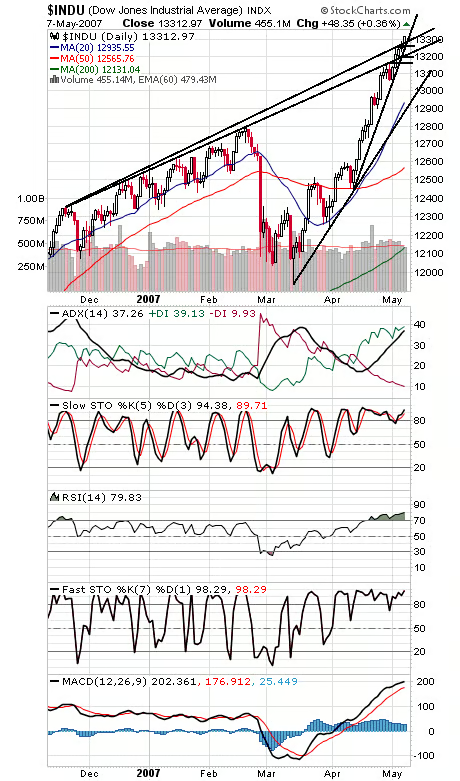
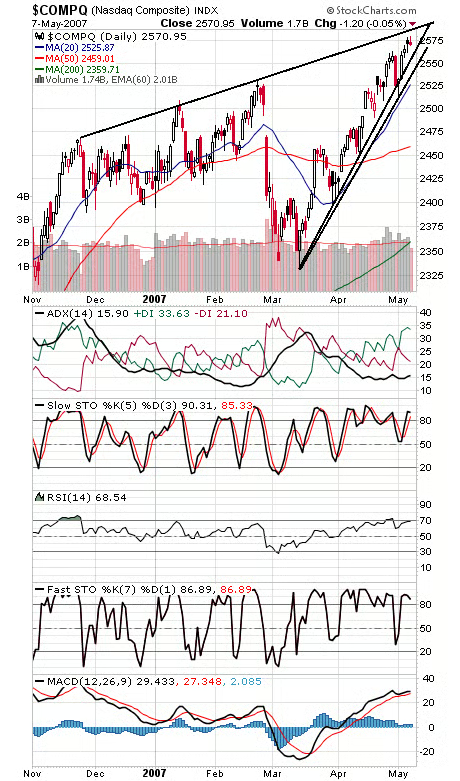
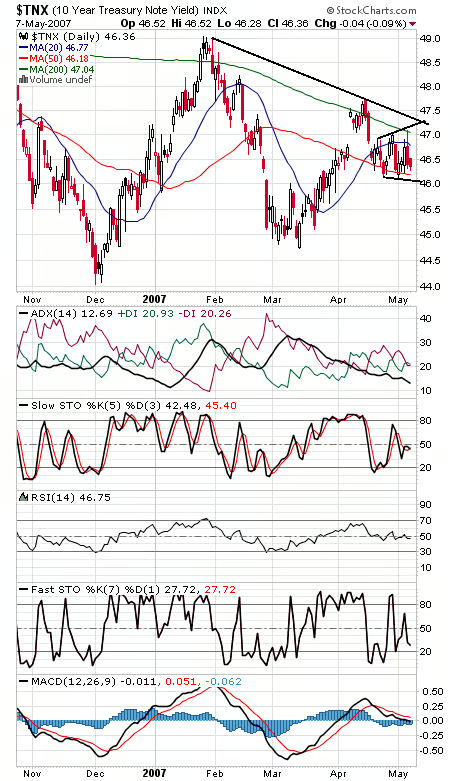
The S&P (first chart below) continues to stall at a rising upper trendline that has constrained rallies since November, and with the CBOE equity-only put-call ratio hitting 0.45 today, it may be time for a pullback. If the index can head higher, its all-time closing and intraday highs of 1527.46 and 1552.87 are next. Support is 1497-1502. The Dow (second chart) continues to push higher in one of the longest runs in the history of the index, but with selling pressure (-DI) all but nonexistent, that index too could be ripe for a pullback. Support is 13,290-13,300, 13,260 and 13,200-13,210. The Nasdaq (third chart) hasn’t quite had the strength to make it to the same resistance line that’s stopping the S&P. Resistance is 2587, and support is 2560 and 2542. No change for bond yields (fourth chart), which remain very much stranded between their 50-day and 200-day averages here.