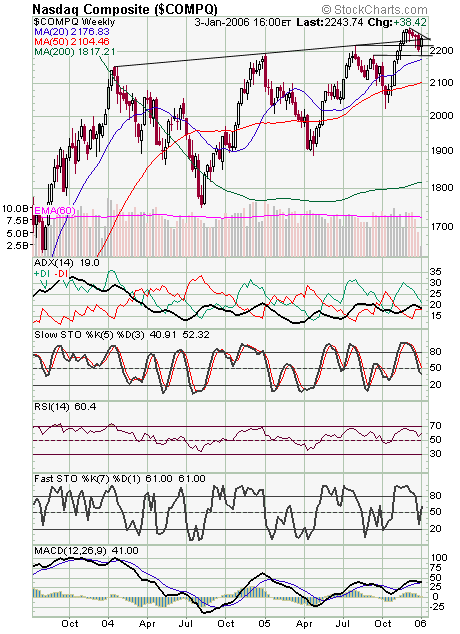
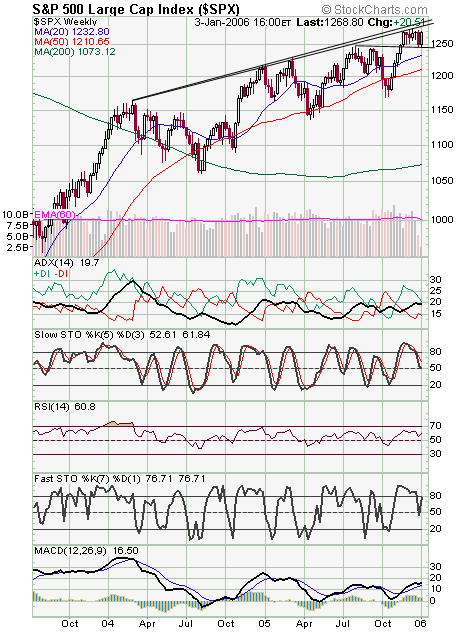
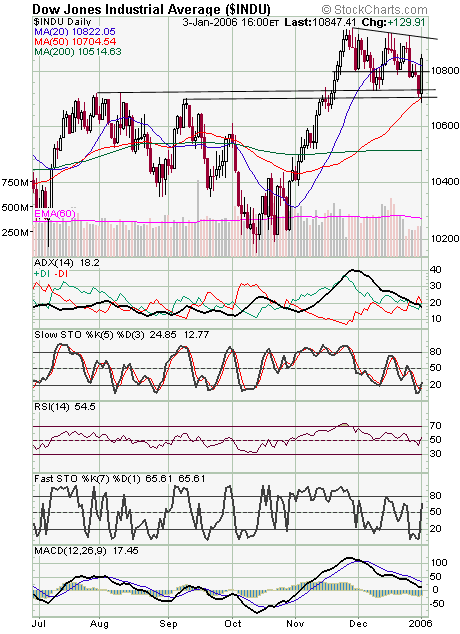
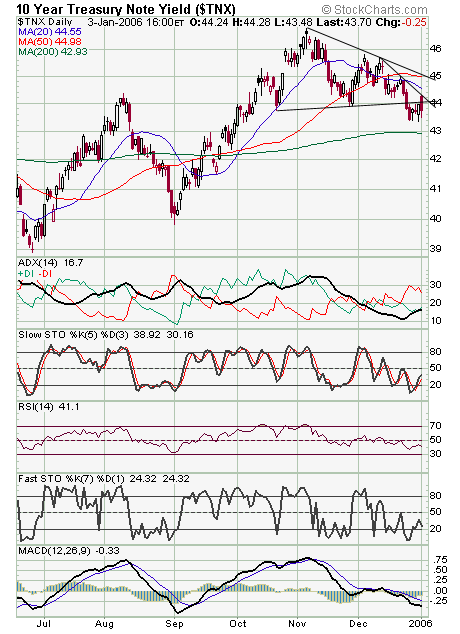
Quite a turnaround for stocks today, with the S&P (first chart below) once again nearing its two-year resistance line at 1280-1285. Can the index clear it this time? We’d note one negative here — bulls in the Investors Intelligence survey last week reached 60%, a level that has occurred near intermediate-term tops over the last couple of years. Also, the major indexes recently registered DeMark Sequential sell signals, similar to the buy signals that worked so well in late April. Between resistance and sentiment, the S&P could face tough going beyond the next 1% or so. To the downside, 1246-1250 is critical support. The Nasdaq (second chart) is back above its two-year resistance line at 2240, but faces a five-week downtrend line just above today’s high of 2250. Support is 2240, 2230, 2220 and 2190-2200. The Dow (third chart) faces difficult resistance between 10,920 and 11,000, and support is 10,800 and 10,684-10,720. Long bonds (fourth chart) continue to be supportive here; no complaints there.
Finally, we’ll once again examine a couple of Dow-based approaches for the year ahead. The Trouncing the Dow approach was flat in 2005, thanks to 10% declines in Wal-Mart and Pfizer. Here’s a link to this year’s list, courtesy of BenchmarkInvesting.com. We’ll also note another approach that has done quite well in recent years — Larry Williams’ “Dow Darlings”, which returned 18% last year and is currently in cash after a sell signal last week.


