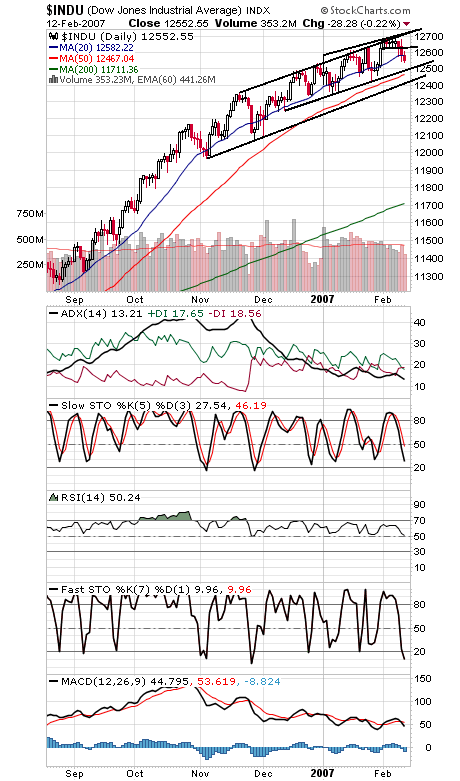
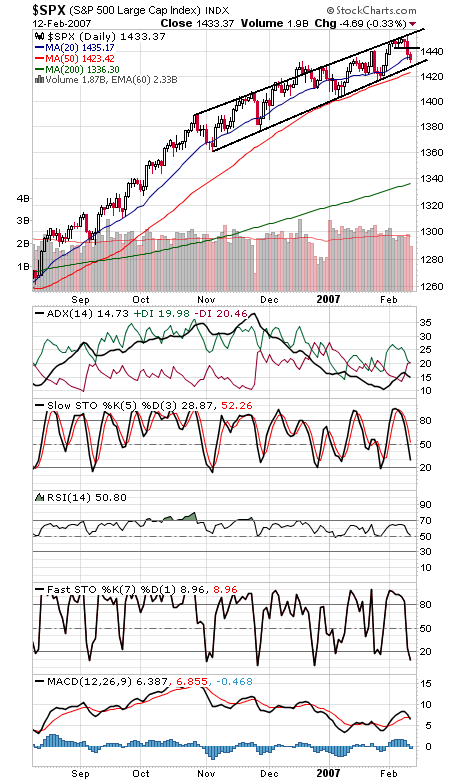
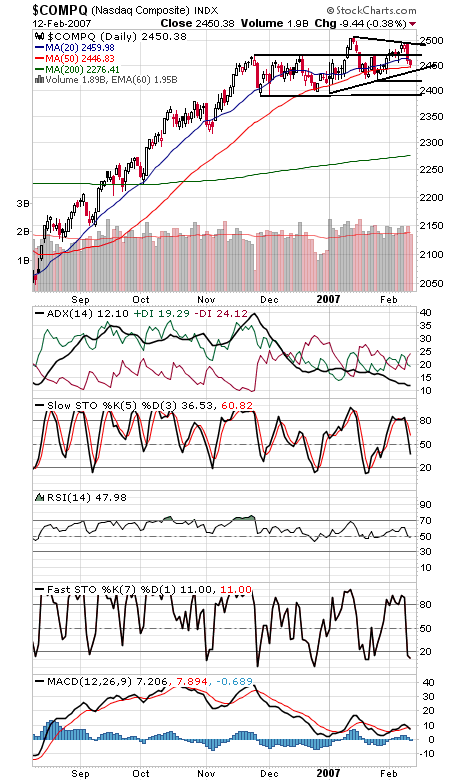
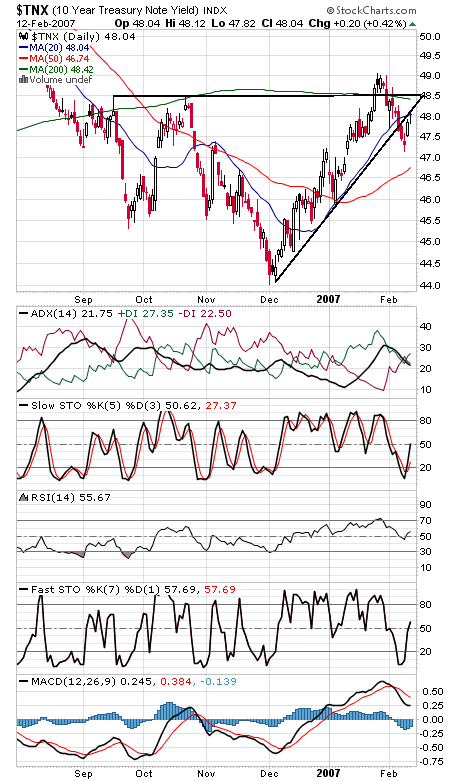
The pullback still hasn’t done much in the way of technical damage, but it doesn’t have far to go if it’s going to cause some. The S&P (first chart below) is about 4 points above its November channel line here, a level the market needs to hold to avoid tipping the advantage to the bears. Below that, the 50-day average at 1424 could make for a final stand. To the upside, first resistance remains 1443-1444; that would create some overlap in the downtrend and suggest that the move down is corrective. A very narrow market, with only about 30 points between the top and bottom of that channel, hence the very choppy trading. The Dow (second chart) has important support at 12,500, 12,470 and 12,420, and resistance remains 12,614-12,630. The Nasdaq (third chart) is trying to find support at 2440-2550; if that level fails, 2430 and 2410-2420 come into play. To the upside, 2460 and 2471 are resistance. 10-year yields (fourth chart) tested their recent breakdown today; another index flirting with critical levels.


