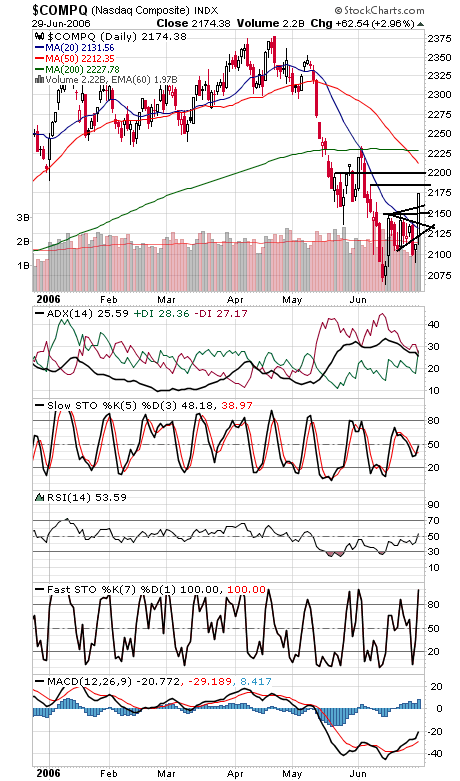
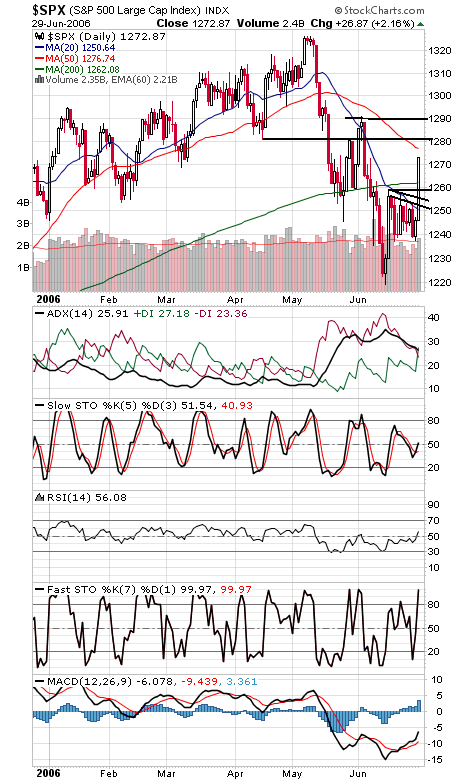
There’s no arguing with momentum, and for the moment at least, it continues to be pointed higher. Certainly sentiment supports the bulls, and even commercial futures traders have reduced their S&P short positions in recent weeks. The one reason for caution is that the cycles remain negative for the next few months, so a retest or even a lower low remains a possibility in the September/October timeframe. One possible bearish scenario to be on the lookout for is an A-B-C correction in Elliott wave terms, which would be two waves higher interrupted by a correction — if that is in play, the rally might stall out at 11,330 on the Dow, 2177 on the Nasdaq, and 1277 on the S&P — the last two levels not far from today’s close. The Nasdaq (first chart below) faces resistance at 2177, 2185 and 2200, and support is 2160, 2150 and 2135. The Dow (second chart) faces resistance at 11,280-11,290 and 11,330, and support is 11,131, 11,100 and 11,030-11,050. The S&P (third chart) has support at 1262, 1258 and 1255, and resistance is 1277, 1281 and 1291. Long bond yields (fourth chart) liked today’s news too, but not nearly as much as stocks.