With stocks retesting their January lows, it will take more of a bid under the market than we saw today to keep from breaking those lows.
There were some positives today, such as outperforming financials, techs and small caps, that could suggest that downside momentum is drying up. And put-call indicators are at or near records.
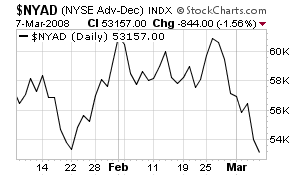
But commercial futures traders have started shorting the big S&P contract again, not typically a good sign for stocks. And the advance-decline line (first chart below) set a new low today, so the market isn’t getting much support from the broad list here.
So onto the weekly charts to find the next support levels if the indexes can’t hold here.
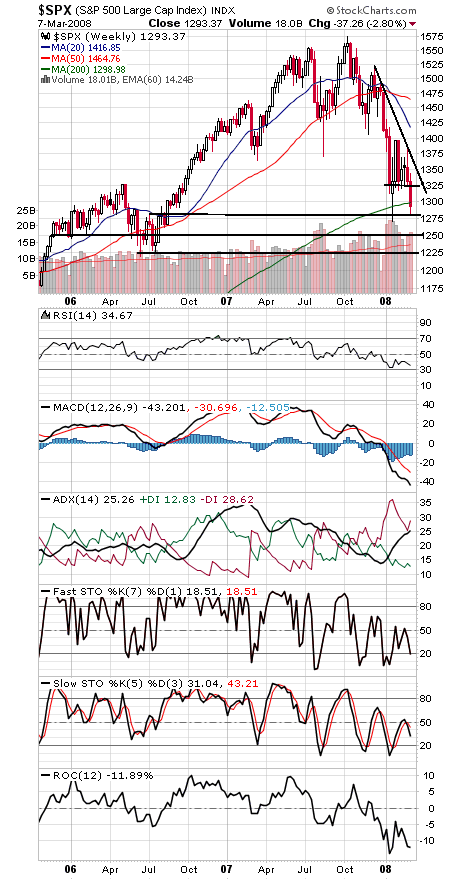
The S&P 500 (second chart) is barely holding above its lows at 1270-1275. If those go, 1250 and 1219-1225 come into play. 1300, 1313 and 1320-1325 are first resistance.
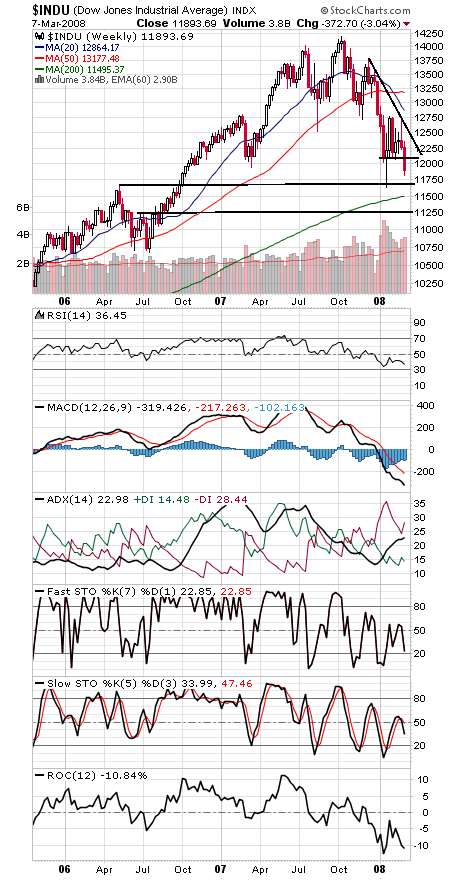
The Dow (third chart) has major support at 11,750 and 11,635, and 12,000 and 12,100 are the start of resistance.
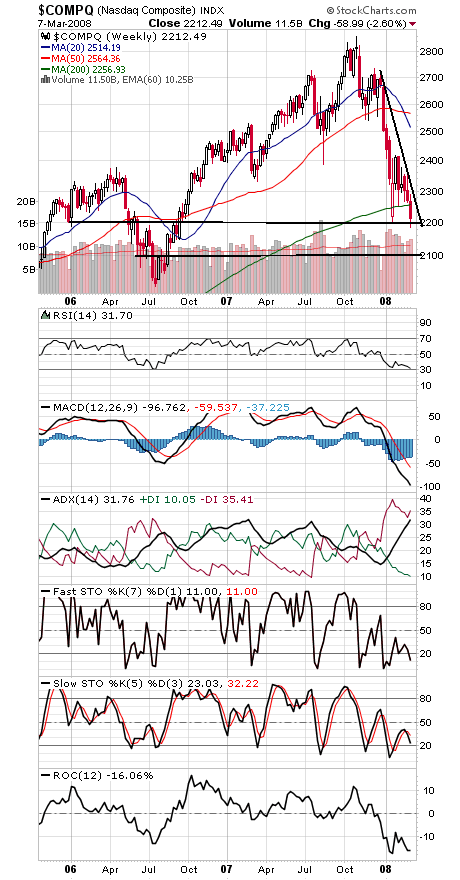
The Nasdaq (fourth chart) looks very oversold on a weekly chart, but doesn’t have much support until 2100. 2250-2300 is resistance.
Paul Shread is a Chartered Market Technician (CMT) and member of the Market Technicians Association.


