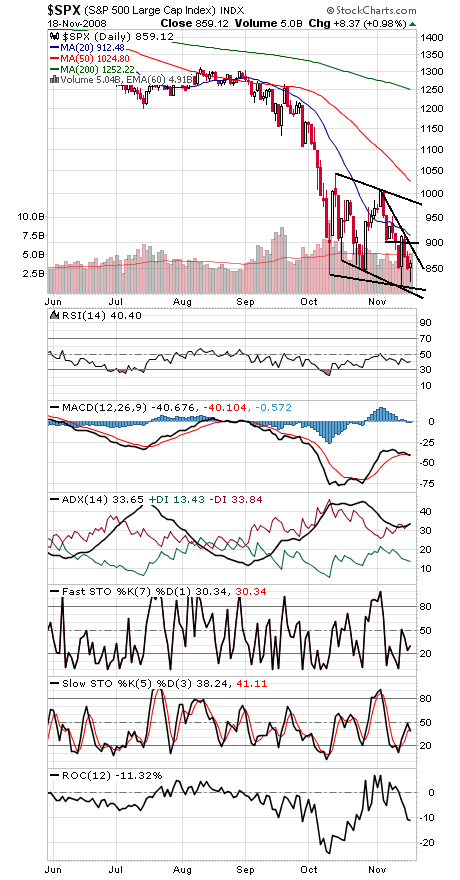
The market is so far just barely hanging on to support at 850 on the S&P (first chart below). About the only good news if that support goes is that 790 should turn out to be even stronger support.
As we’ve been saying since October 10, stocks are extremely oversold here on a historical basis. How oversold? Let’s look at one indicator, the nine-month rate of change (ROC), from Martin Pring’s “Technical Analysis Explained.”
In short, the theory states that when the nine-month ROC falls below 20% and then turns up, major bottoms typically form. We’re obviously still waiting for ROC to turn up, but what’s interesting is just how extreme the current reading is on the Dow (-32%). That exceeds the -28% reading at the 1974 low and is exceeded in the Dow’s 112-year history only by the -34% to -40% readings at the 1937-1938 low — and the -68% reading at the 1932 low, a nasty outlier we can hope is never repeated. But even the 1929-1932 bear paused for several months when it hit the -30% mark.
In short, the combination of strong support and extreme oversold readings should limit downside from here, but a strong turn up for the market would be even better for the bullish case.
A good start for the S&P (first chart below) would be a move above 880, with 900-917, 952 and 980 the next hurdles above that. To the downside, 850 remains ideal support, with 840, 815-825, 800 and 768-789 below that.
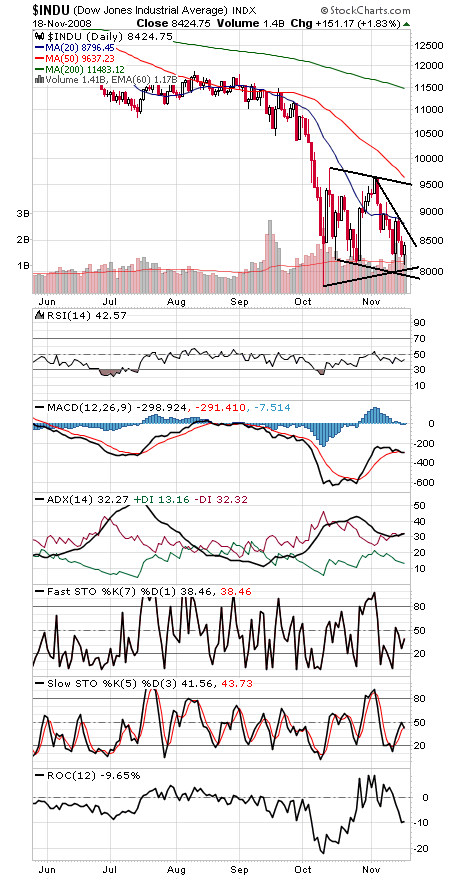
The Dow (second chart) faces tough first resistance just above 8600, with 9000 and 9500 important levels above that if the bulls can get a run going. The most important supports remain the intraday and closing lows of 7882.51 and 8175.77, respectively.
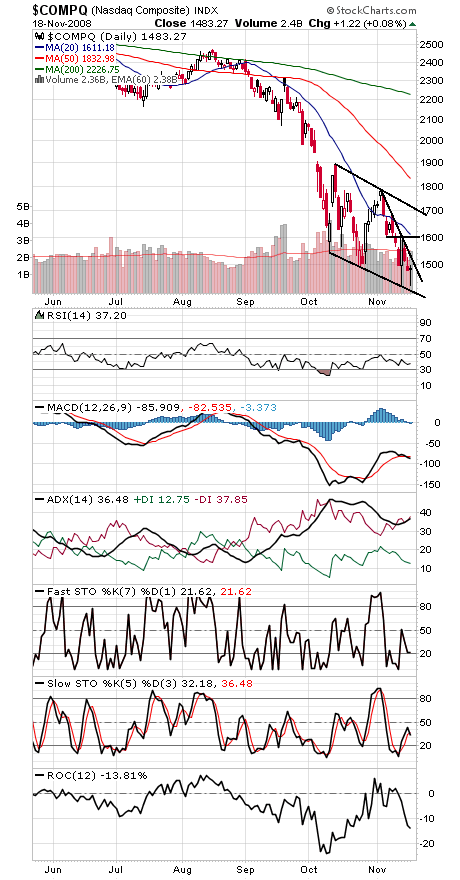
The Nasdaq (third chart) would generate a nice breakout with a move just above 1500, with 1600 the next major resistance above that. Support is 1400-1430.
Paul Shread is a Chartered Market Technician (CMT) and member of the Market Technicians Association.


