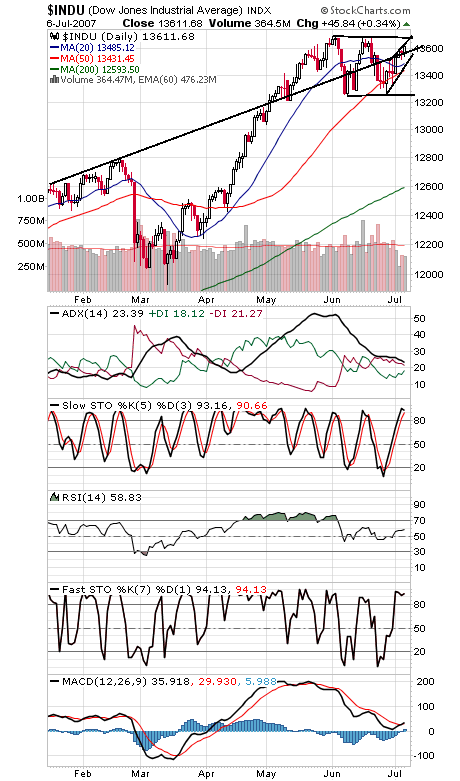
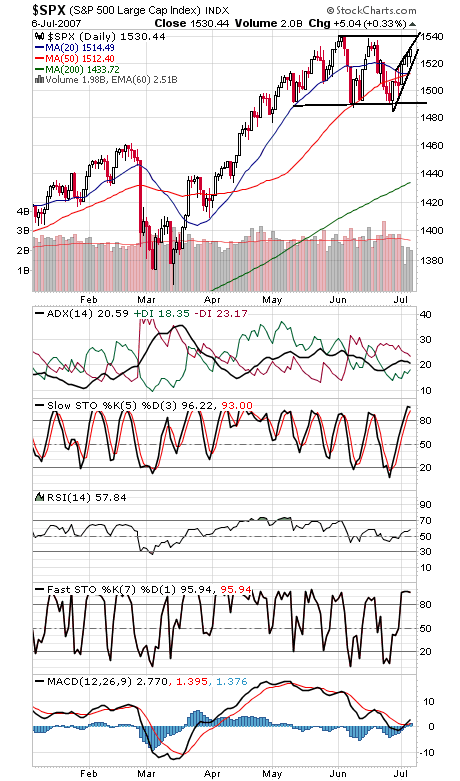
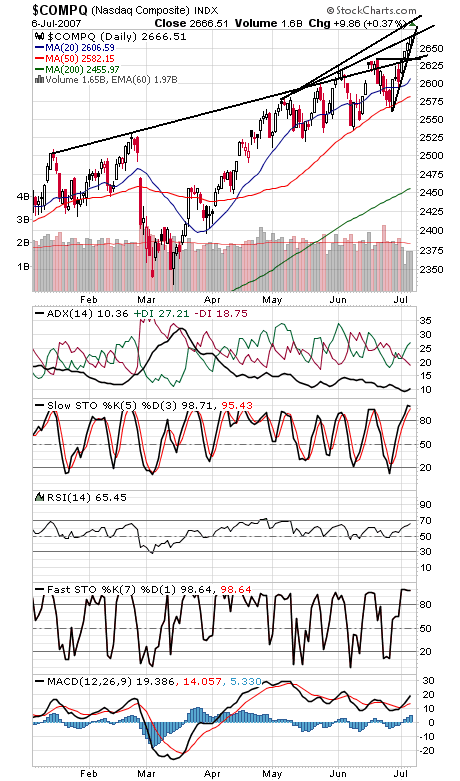
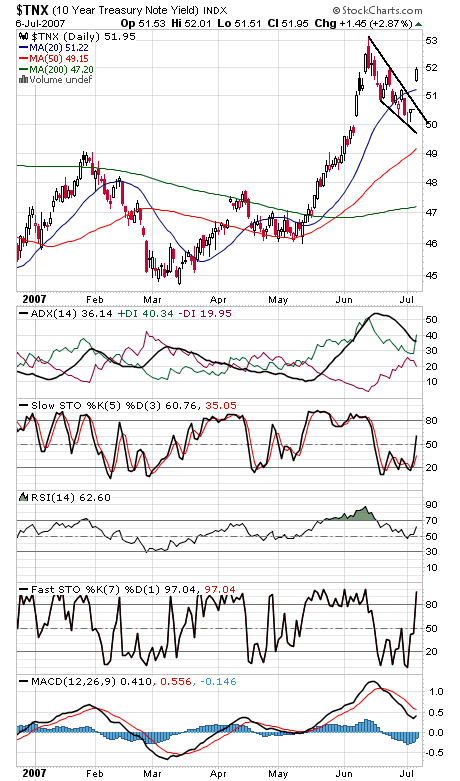
The Dow and S&P (first two charts below) are nearing the top of a two-month trading range, but they’re sure not showing the kind of strength they’ll need to break out of it. On the plus side, the Nasdaq (third chart) has already broken out, so if the techs are a leading sector, the big caps may yet follow. The Dow faces resistance at 13,692-13,700, and support is 13,570 and 13,500. The S&P faces resistance at 1540 and its all-time high of 1552.87, and support is 1523 and 1512. The Nasdaq’s next hurdle is 2680, and support is 2650, 2640 and 2632-2635. The 10-year yield (fourth chart) could be headed to 5.7% if it duplicates its May-June run. That would price in a couple of rate increases.
Paul Shread is a Chartered Market Technician (CMT) and member of the Market Technicians Association