SHARE
Facebook X Pinterest WhatsApp

Technical Analysis: Stocks Find Support

Written By
thumbnail
Paul Shread
Paul Shread
Jun 29, 2006

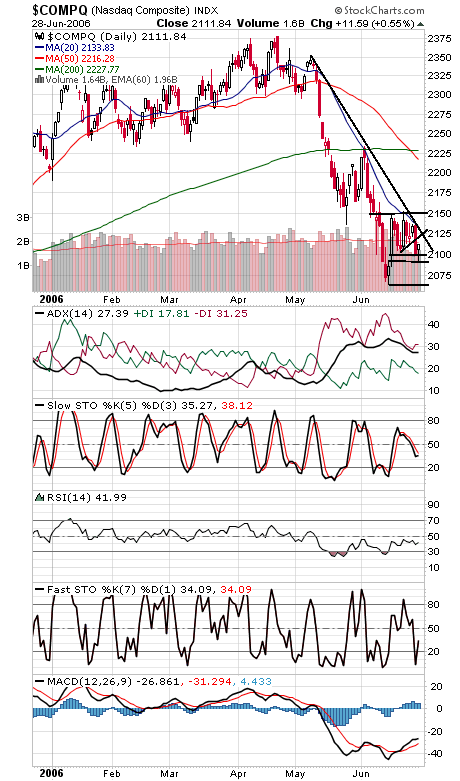
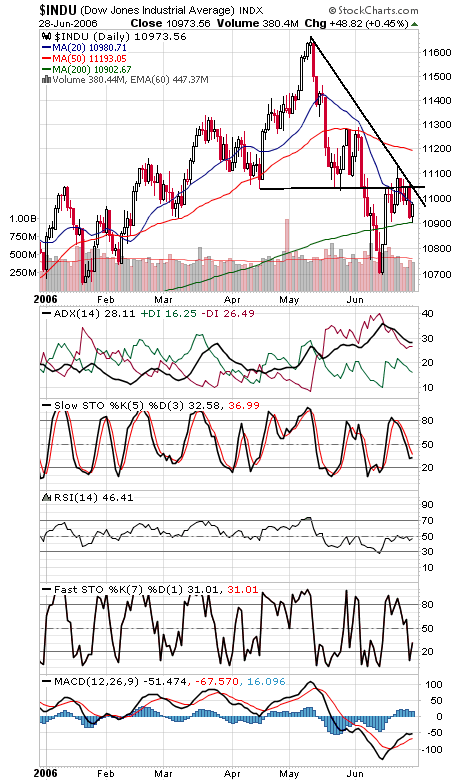
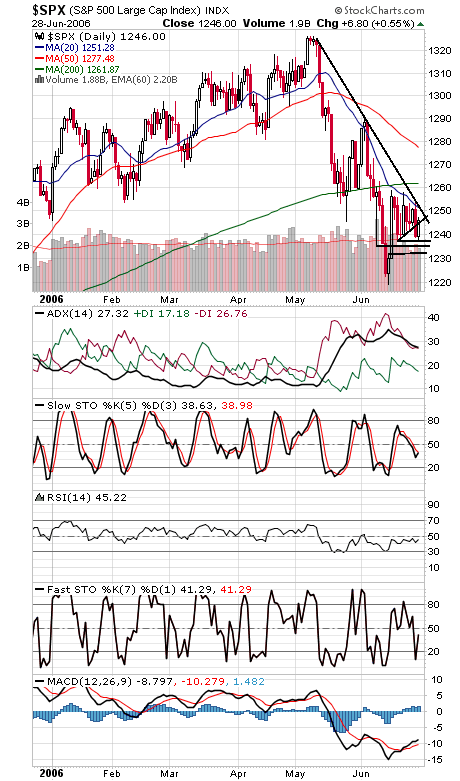
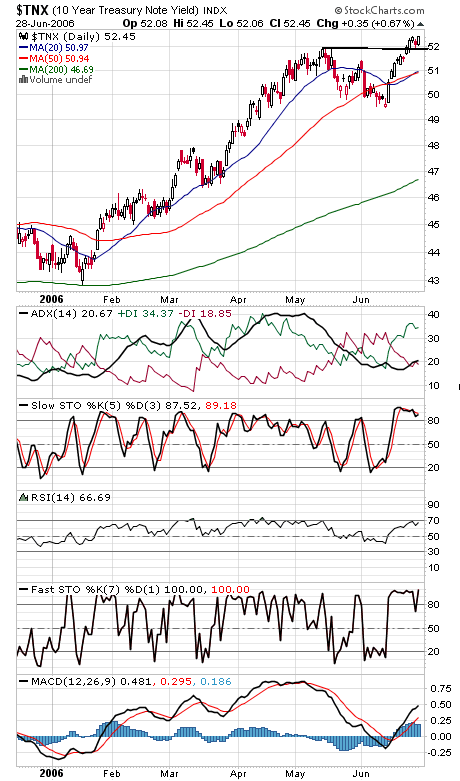
The Nasdaq and Dow (first two charts below) held important support levels today. The Nasdaq turned higher after testing 2090, the top of its first wave up off the recent lows. 2100, 2090 and 2065 are support, and 2125 and 2150 are resistance. The Dow held its 200-day average just above 10,900, which remains support for Thursday. Resistance is 11,020-11,050. The S&P (third chart) held 1235-1237 support today, with 1232 below that. Resistance is 1250 and 1262. Long bond yields (fourth chart) continue to set new highs.


Recommended for you...

U.S. Needs to Protect Tech Leadership: Qualcomm
Rob Enderle
Apr 8, 2022
HP’s ExtendXR Service Gets an Early Lead on a Looming Metaverse Problem
Rob Enderle
Mar 5, 2022
Cisco’s Purpose Is to Improve the World. Imagine if Others Followed.
Rob Enderle
Dec 17, 2021
HP Builds an Advanced Cloud Workstation for the Metaverse
Rob Enderle
Nov 13, 2021
Internet News Logo

InternetNews is a source of industry news and intelligence for IT professionals from all branches of the technology world. InternetNews focuses on helping professionals grow their knowledge base and authority in their field with the top news and trends in Software, IT Management, Networking & Communications, and Small Business.

Property of TechnologyAdvice. © 2025 TechnologyAdvice. All Rights Reserved

Advertiser Disclosure: Some of the products that appear on this site are from companies from which TechnologyAdvice receives compensation. This compensation may impact how and where products appear on this site including, for example, the order in which they appear. TechnologyAdvice does not include all companies or all types of products available in the marketplace.