Note: The Technical Analysis column will return on Thursday.
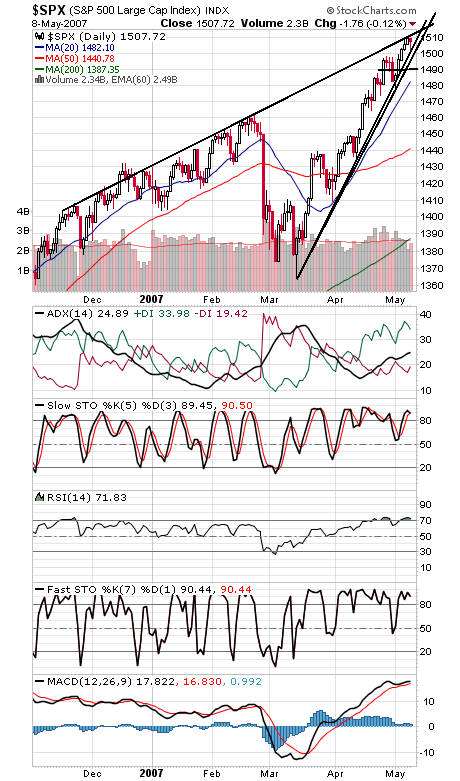
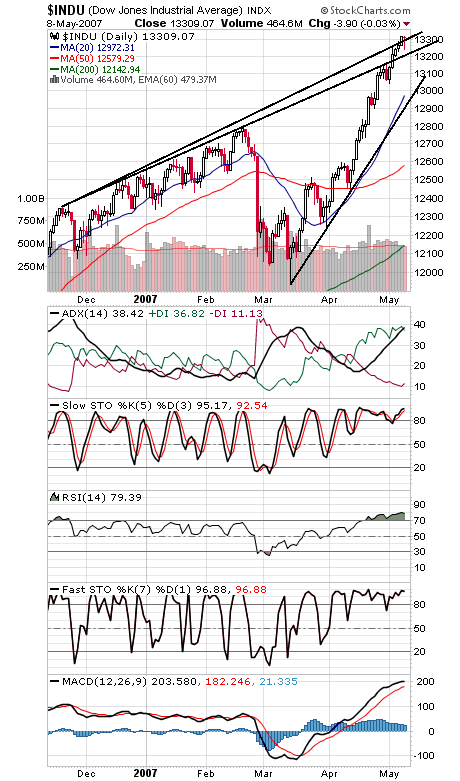
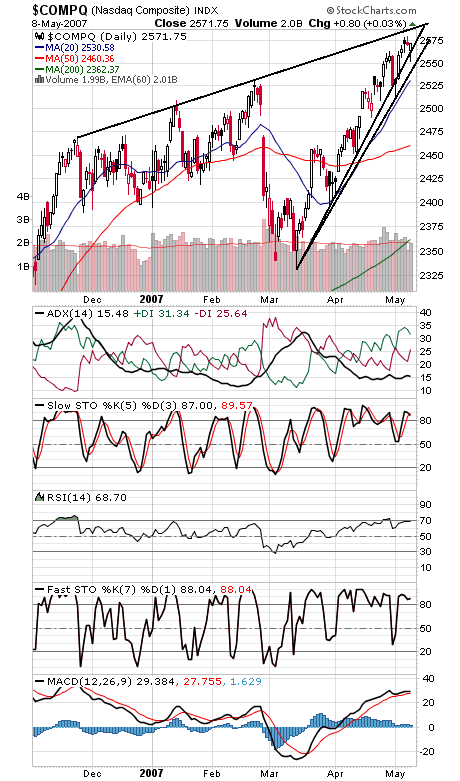
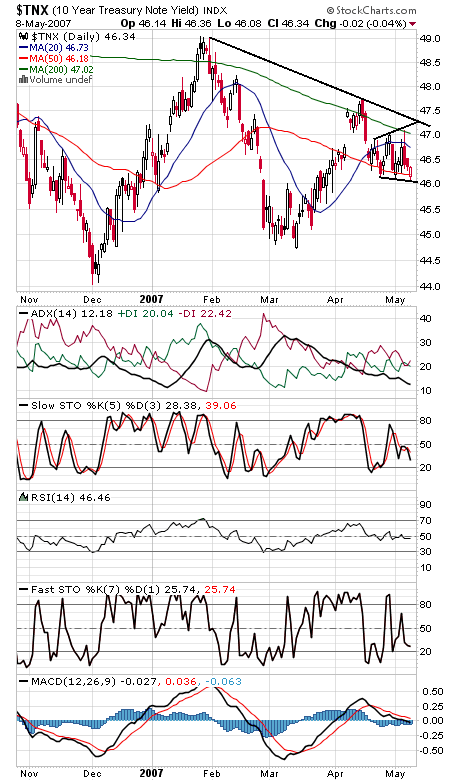
The S&P (first chart below) remains the big obstacle for the market here. Above 1512-1513 and the all-time closing and intraday highs of 1527.46 and 1552.87 come into play. Support is 1505, 1500 and 1490. The Dow (second chart) has support at 13,300 and 13,210. The Nasdaq (third chart) faces resistance at 2588, and support is 2545. No change for bond yields (fourth chart), which remain stuck between their 50-day and 200-day averages for the third straight week.