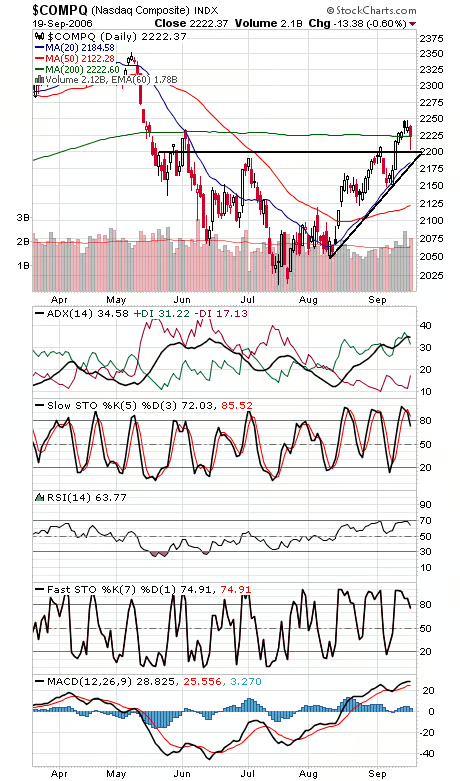
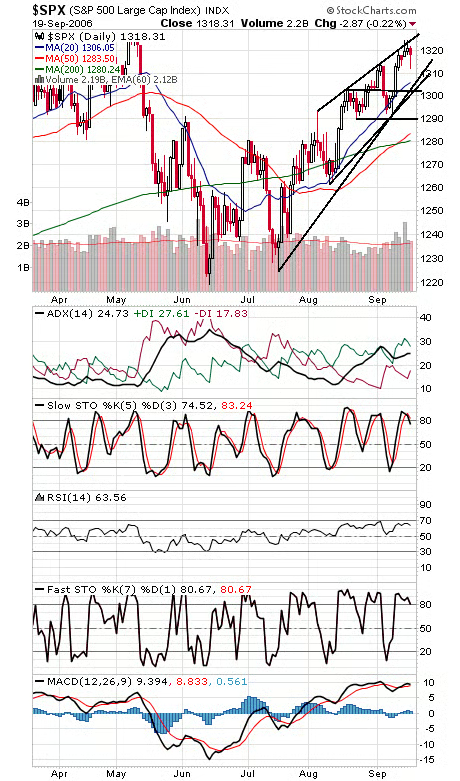
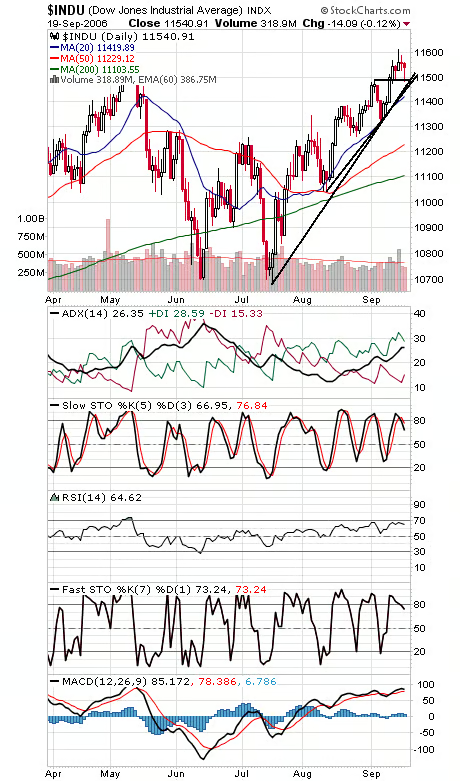
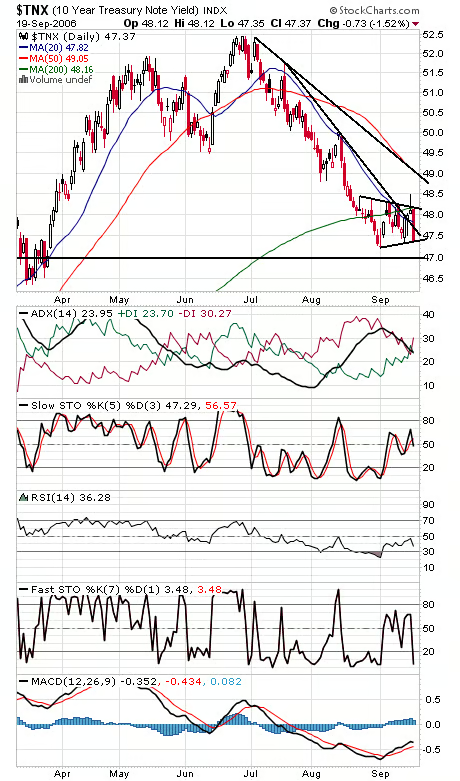
Quite a shakeout today, but stocks held on well considering. It will be interesting to see how the slowdown and currency fears that sparked today’s sell-off play out in the weeks ahead. They could be fodder for an October sell-off — or yet more proof of the market’s impressive resilience this year. For a look at what’s been propping up the market, just take a look at ISE options numbers — the 50-day average is at its lowest since November 2002. That’s a big plus for stocks, but we’re in a window for the next few weeks where sentiment can get worse before it gets better. The Nasdaq (first chart below) held the 2200 level nicely today. Below that, 2185 is major support, and 2250-2260 remains a tough hurdle to the upside. The S&P (second chart) found support at 1312 today. 1326-1327 is major resistance, and support is 1311-1312 and 1303-1306. The Dow (third chart) held 11,480 support today. 11,460-11,480 is critical support, and 11,600, 11,640-11,670 and 11,722-11,750 are the levels to beat to the upside. Bonds (fourth chart) continue to be a place to hide here; that might continue a few weeks longer.