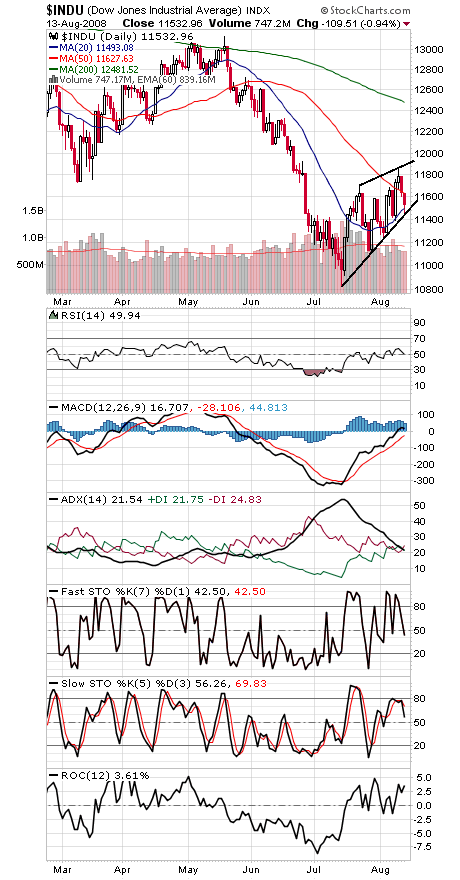
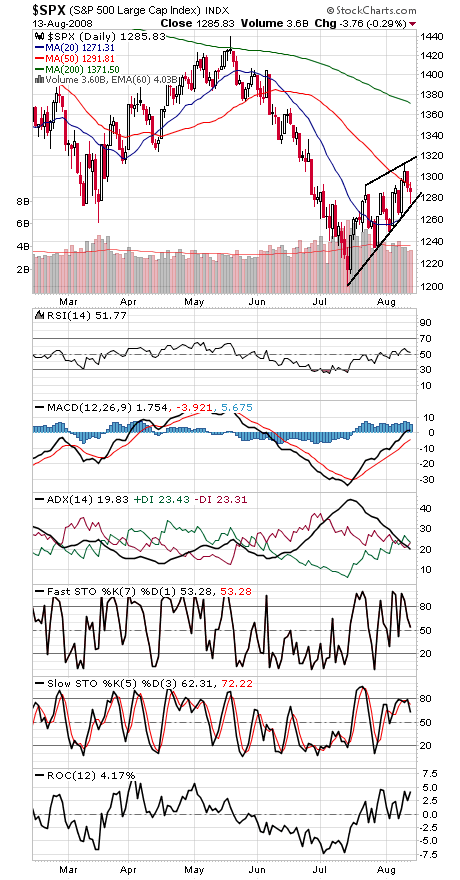
A nice save by the bulls today, as the Dow and S&P (first two charts below) found support at their main uptrend lines. Those lines will be at 11,480 and 1277 and rising as of tomorrow.
To the upside, both indexes need to take out those upper trendlines — at 11,910 and 1318 and climbing — to avoid forming bearish rising wedges on the indexes, which would suggest eventual new lows. In short, two critical trendlines to watch on two very important indexes.
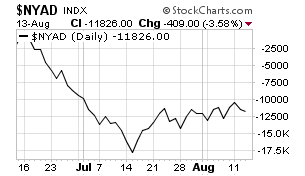
One positive is that the NYSE advance-decline line (third chart) has so far made new highs along with the indexes, so that broad-based buying suggests enough buying power to support stocks a while longer. The market will become vulnerable when the A-D line is no longer making new highs along with the indexes.
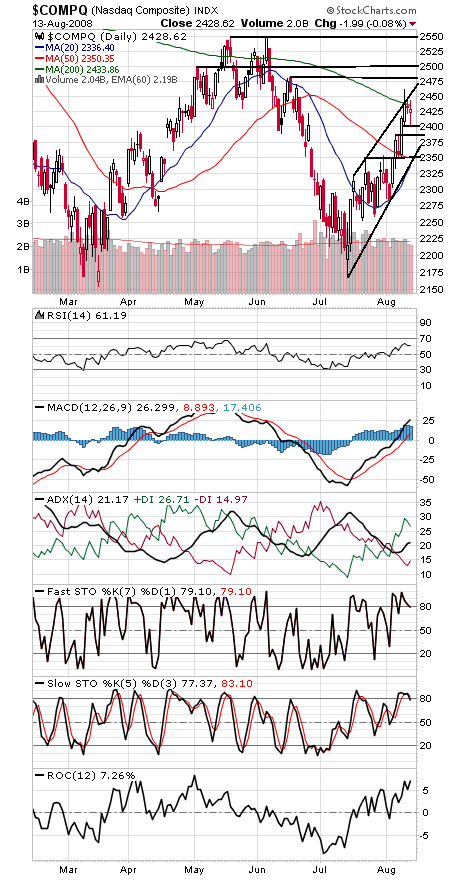
The Nasdaq (fourth chart) remains the strongest of the major indexes, but unless blue chips can strengthen, the tech sector could become vulnerable to a decline. Resistance is 2434, 2461, 2483 and 2500, and support is 2400, 2386 and 2350.
Finally, with the SEC temporary ban on naked short-selling now expired, we’ll offer anecdotal evidence to suggest that the SEC may want to reinstate permanent controls on short-selling: From July 2007, when the 70-year-old uptick rule was rescinded, until mid-July, when the naked short-selling ban was announced, the market had more 90% volume and point days (when the vast majority of volume and points gained or lost move in the direction of the trend) than anytime in nearly 60 years, according to Lowry Research — and those kind of days usually only occur at major market bottoms. The last 90% day was to the downside on June 26. Since the July 15 SEC announcement, there have been no 90% days.
Coincidence? We can’t say for sure, but the high number of 90% days that have occurred in the last year suggests that short-selling controls may have contributed more to market stability than the SEC realized.
Paul Shread is a Chartered Market Technician (CMT) and member of the Market Technicians Association.


