Despite a number of positives — like commercial long positions in the S&P and more bears than bulls in the weekly Investors Intelligence survey for the first time since mid-April — stocks just can’t get going here.
The action remains very much in keeping with historical action after market panics. How long it will take for weak positions to be shaken out is anyone’s guess, but a rally between now and mid-July would be in keeping with seasonal patterns.
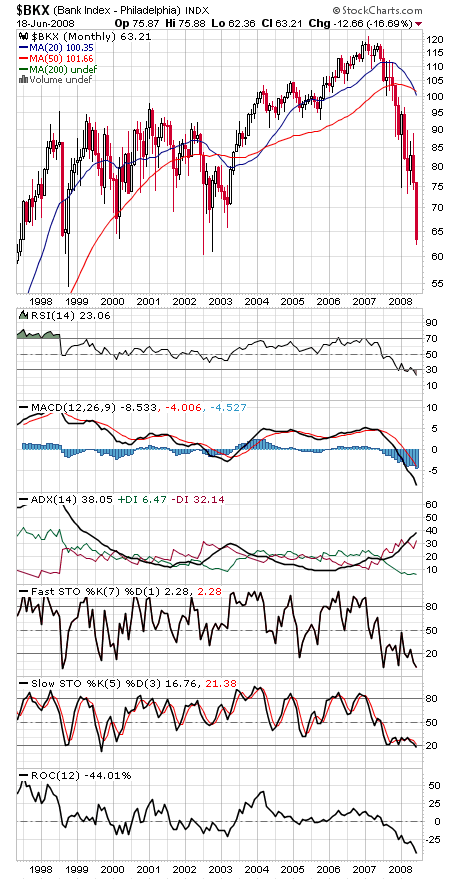
And there may be enough support nearby for that to happen. Topping that list is the bank sector (first chart below), which is closing in on its 2002 and 1998 lows in the next 5-10% (the index fell 3% today).
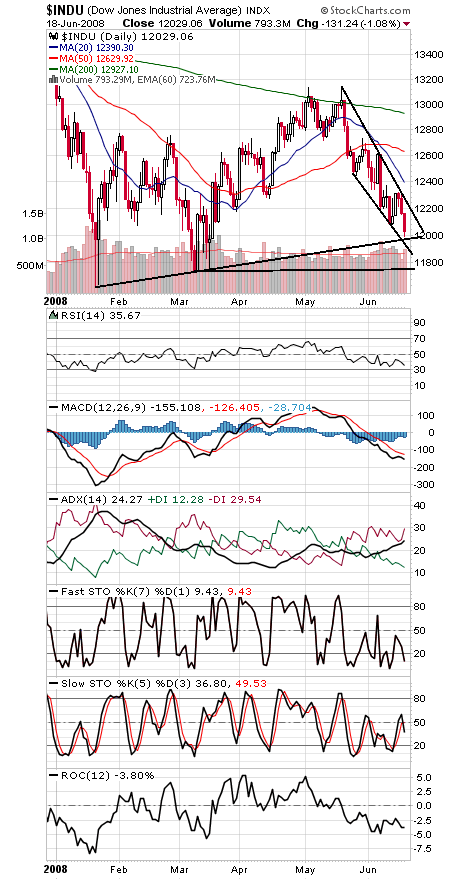
The Dow (second chart) needs to hold around 11,975 or 11,900 and 11,740 come into play. To the upside, 12,200-12,240 is the area that needs to get taken out.
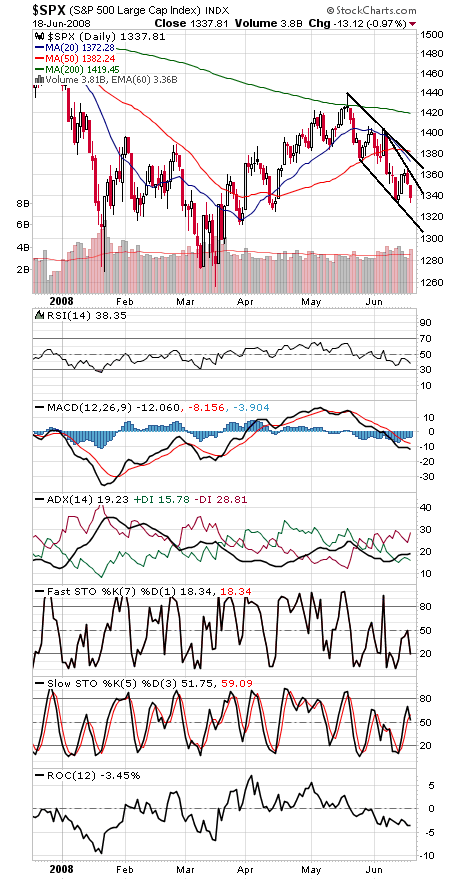
The S&P (third chart) needs to hold 1331 or 1315 could be next. Resistance is 1350 and 1370.
The Nasdaq (fourth chart) has support at 2415 and 2387-2392, and upside hurdles are 2442, 2460, 2483, 2509 and 2551.
Paul Shread is a Chartered Market Technician (CMT) and member of the Market Technicians Association.