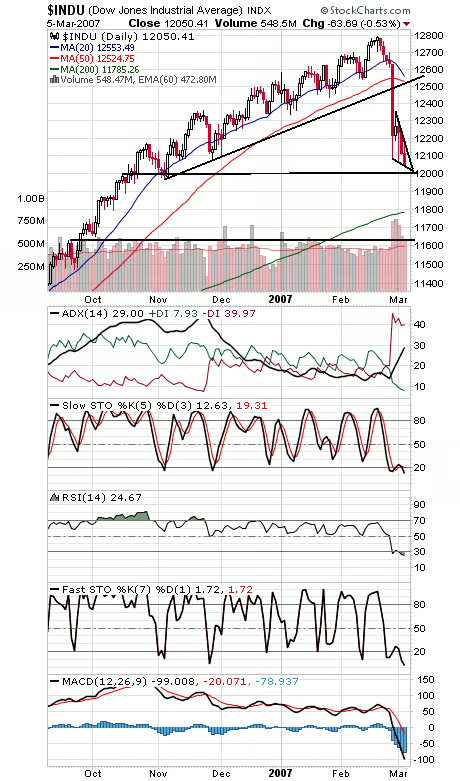
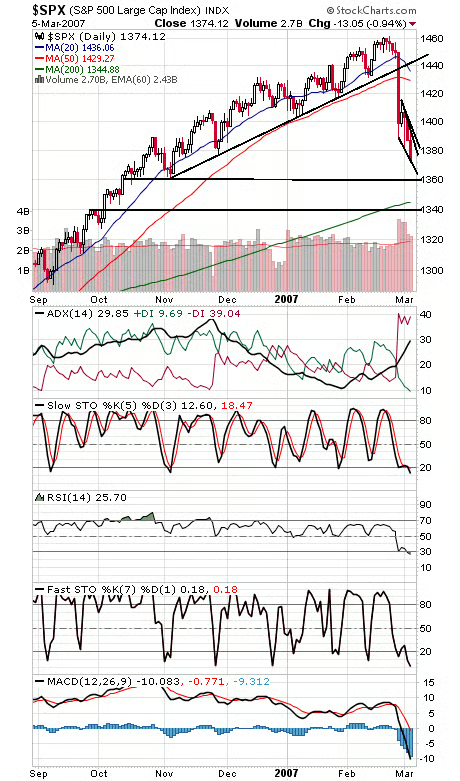
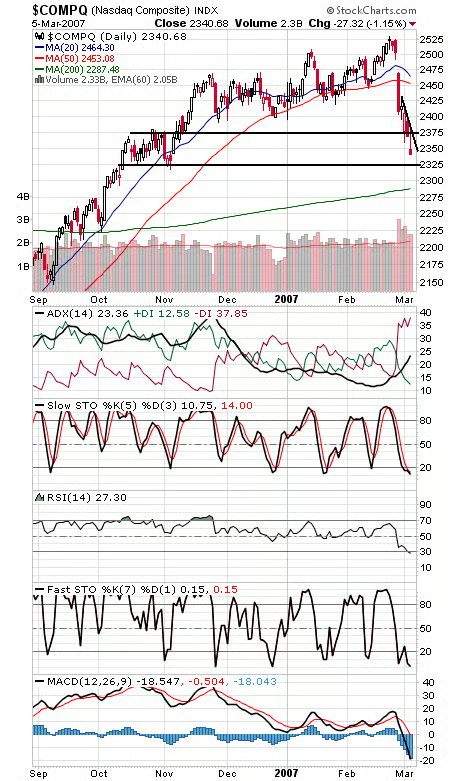
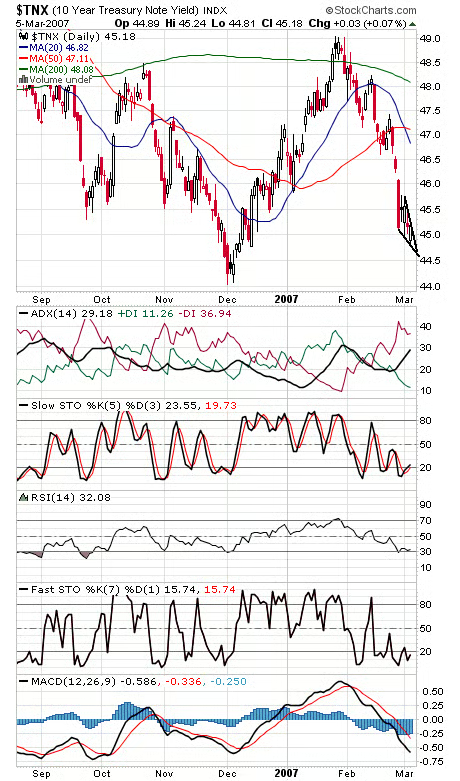
We had our second 90% downside day in a week on the NYSE today, and put-call ratios are through the roof. That is a lot of panic selling, particularly given today’s relatively small decline. Can a bounce be that far off? The Dow (first chart below) has important support at 12,000-12,020, and first resistance is a sharp downtrend line at about 12,120. The S&P (second chart) has important support at 1366 and 1360, and resistance is 1386-1392. Note that both indexes have returned to their early November lows in a matter of days; the rally from that point was choppy, with each pullback overlapping the prior high, a sign of a weak rally. The only part of last year’s rally that didn’t overlap was the period from mid-September to mid-October, so hitting the top of that range could provide some support. All the more reason this is important support coming up. The Nasdaq (third chart) has potential support at 2325, and resistance is 2370-2380. Bonds (fourth chart) are also wedging out here, like the Dow and S&P; a few tentative set-ups for reversals that now need follow-through.