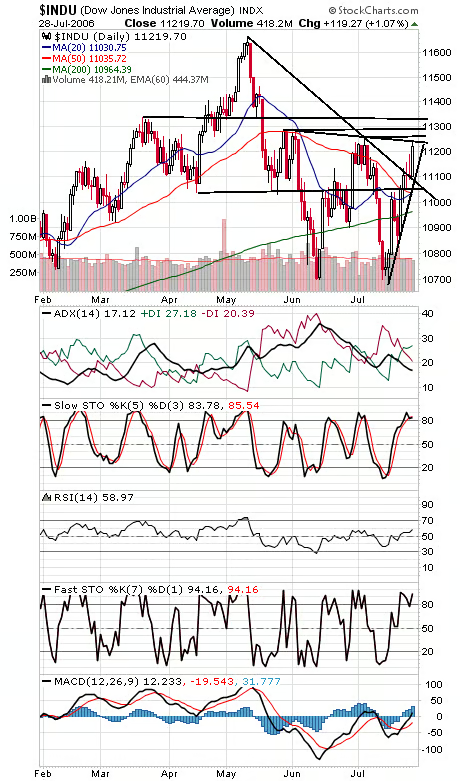
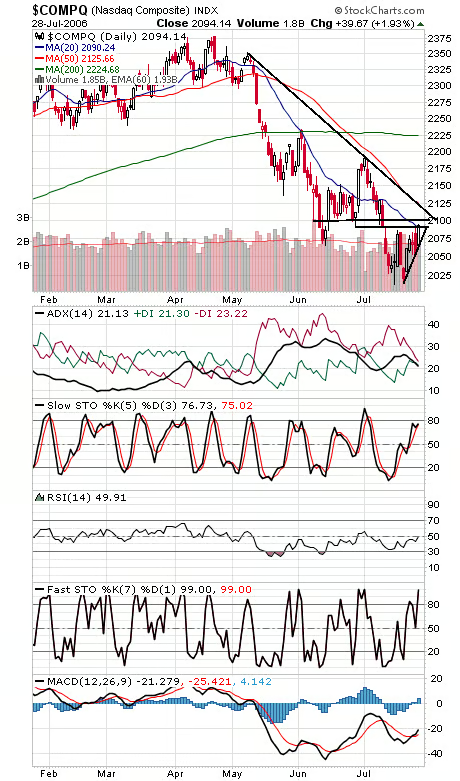
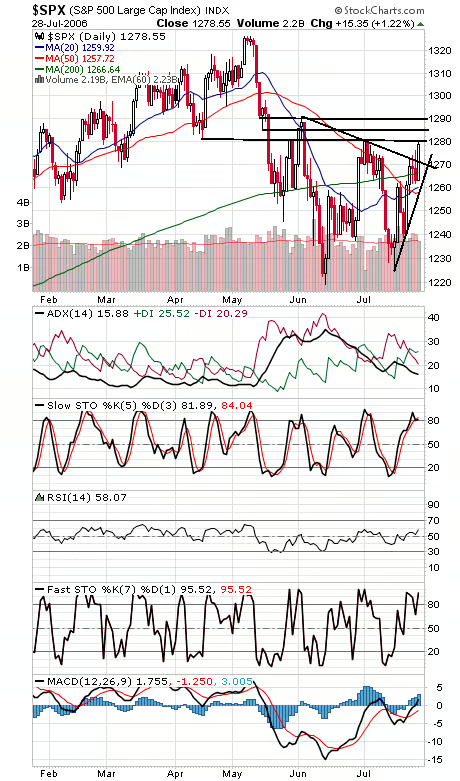
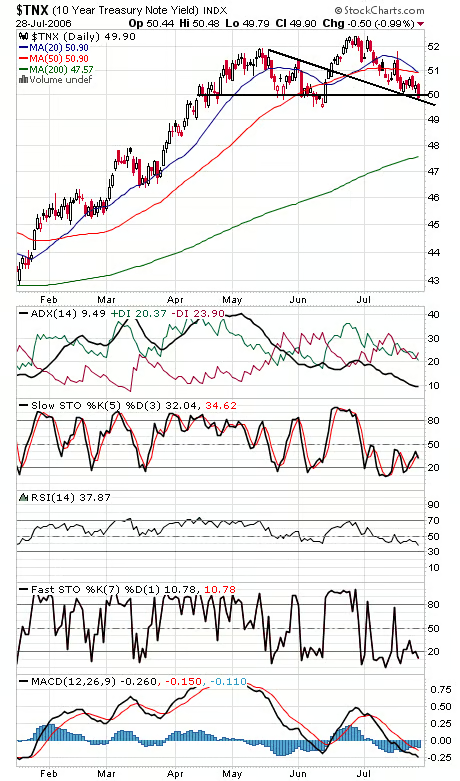
The indexes are all testing some significant levels here. We’ll start with the Dow (first chart below), which faces important resistance at 11,260-11,290 and 11,330; if the blue chips can clear those levels, it may be headed back to the highs, as improbable as that seems for the next couple of months, with weak seasonality and commercial futures traders short the big S&P contract. Support is 11,090, 11,030-11,050, 11,000 and 10,960. The Nasdaq (second chart) is pushing 2090-2100 resistance, with 2120 an even bigger level above that. Support is 2070-2075. The S&P (third chart) is testing 1281 resistance, with 1285, 1287 and 1291 above that. Support is 1270 and 1267. Long bond yields (fourth chart) are creeping below 5%, suggesting a slowing economy.