At this week’s lows, the market has been as oversold as any in the last 70 years, just based on the depth of the decline in a short amount of time. A weekly close below 11,847 on the Dow would be even better, giving us that oversold reading on a weekly closing basis, but stocks appear to be too stretched to the downside for that, at least for now.
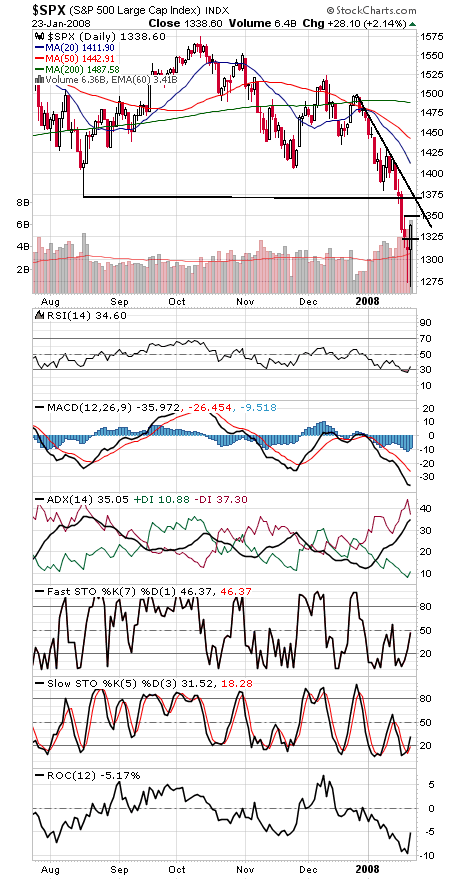
Still, there are other ways to spot bottoms, and we’ll be on the lookout for them. For starters, we expect a lengthy basing period after the decline we’ve had. One good sign of a bottom would be a higher low and higher high in the rate-of-change indictor (ROC at the bottom of tonight’s charts below), a sign that momentum has turned back upward. In fact, it’s hard to find a major low that hasn’t had that positive divergence.
Another would be continued buying by commercial futures traders.
But given the depth of the panic — multiple front-page bearish headlines just about everywhere you look today and yesterday — the credit crisis may largely be priced into stocks at this point. Still, a retest of the lows, and possible lower lows, with positive divergences, may still lie ahead.
1364-1370 on the S&P 500 (first chart below) remains the biggest hurdle for the bulls, with 1350 up first. The first test of that level will likely prove tough. Support is 1320, 1310 and 1270, with 1225-1250 possible below that.
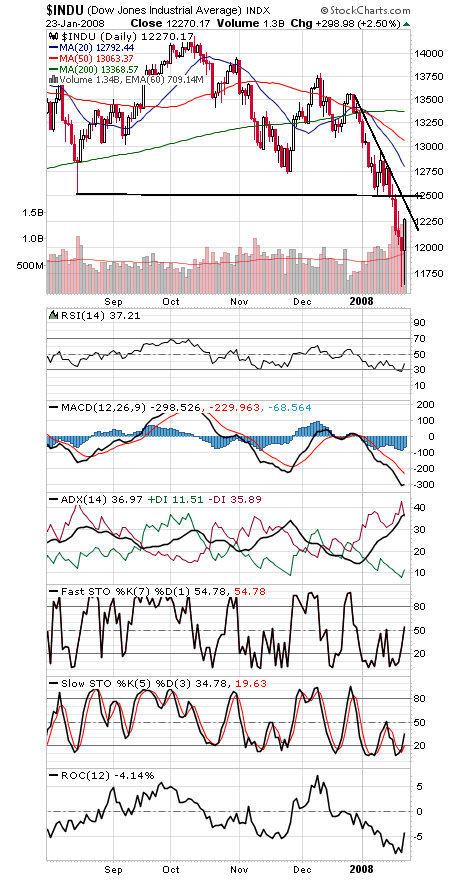
The Dow (second chart) barely held onto yesterday’s low (11,635) today, stopping at 11,644. 12,092 is first support before 11,750-12,000 gets tested again, while 12,400-12,500 looks tough to the upside.
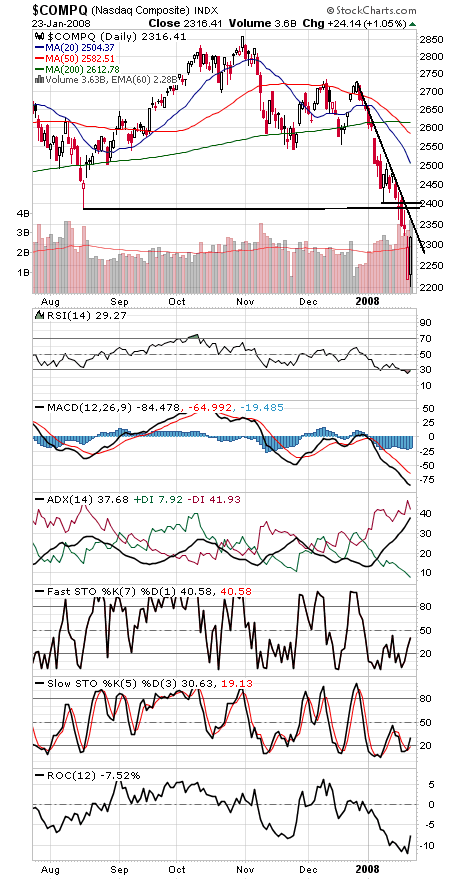
The Nasdaq (third chart) faces resistance at 2323, 2350 and 2387-2400, and 2250, 2221 and 2200 are support.
Paul Shread is a Chartered Market Technician (CMT) and member of the Market Technicians Association.