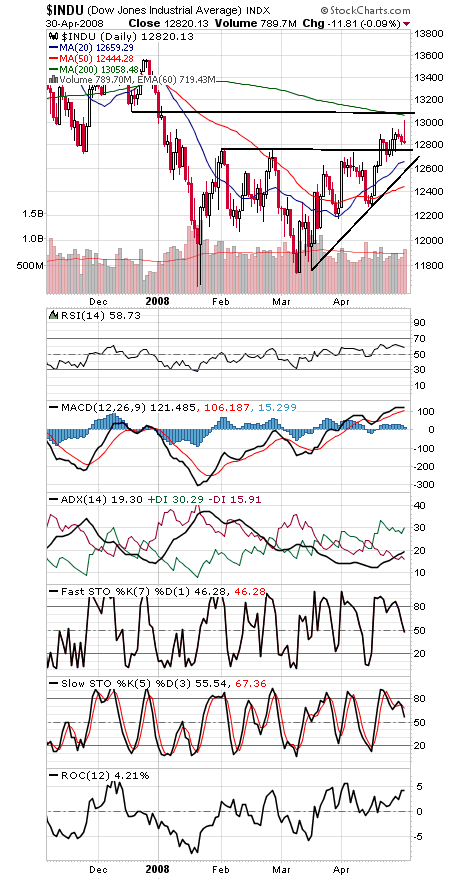
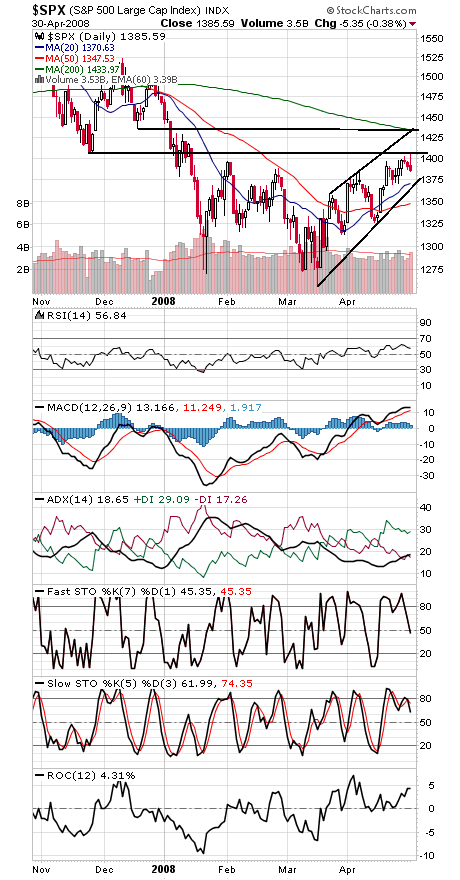
The Dow and S&P ran into some big round numbers today at 13,000 and 1400, respectively. It will likely take some doing to surmount those numbers and the levels just above them (lows from late last year at 1406 and 13,050-13,100), but the market has monthly inflows to aid in that effort for the next couple of days.
Sentiment remains a very long way from toppy. The Investors Intelligence weekly survey came in at 41-32 bulls-bears this week, up from 31-45 bulls-bears on March 19, but a long way from the 62% bulls we saw last fall. And the 50-day average of the ISE call-put reading is at 101, a long way from the levels around 145 we saw at the July peak.
What about the calendar? Certainly this is where you’d normally look to “sell in May and go away,” but with stocks coming off extreme oversold levels and a recent Dow Theory bull signal, the market does not appear to be in a position where it would normally be vulnerable to a major decline. Seasonality certainly seems to have been turned upside down since last fall, and that may continue for a while longer.
The Dow (first chart below) has support at 12,743 and 12,600, and the S&P (second chart) has support at 1370-1375.
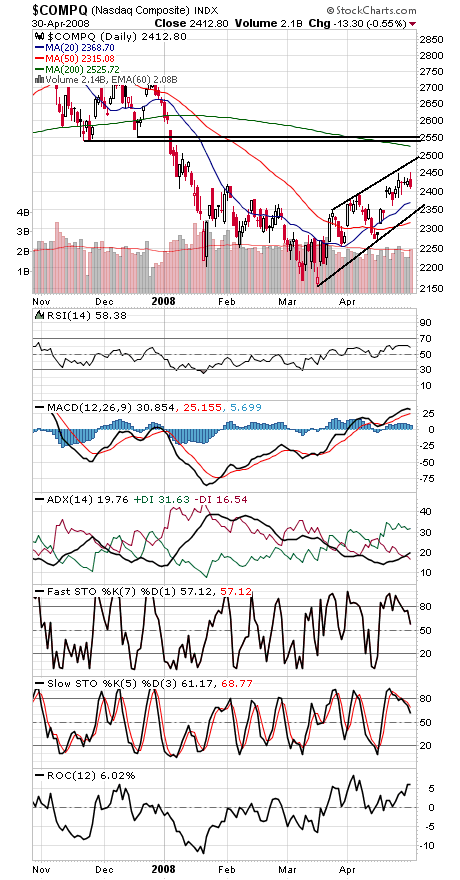
The Nasdaq (third chart) faces resistance at 2450, 2500 and 2525-2550, and support is 2392-2400 and 2350.
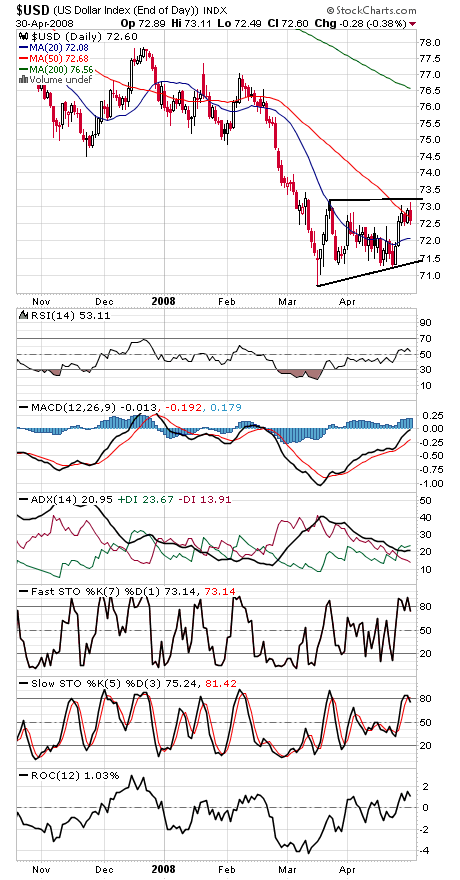
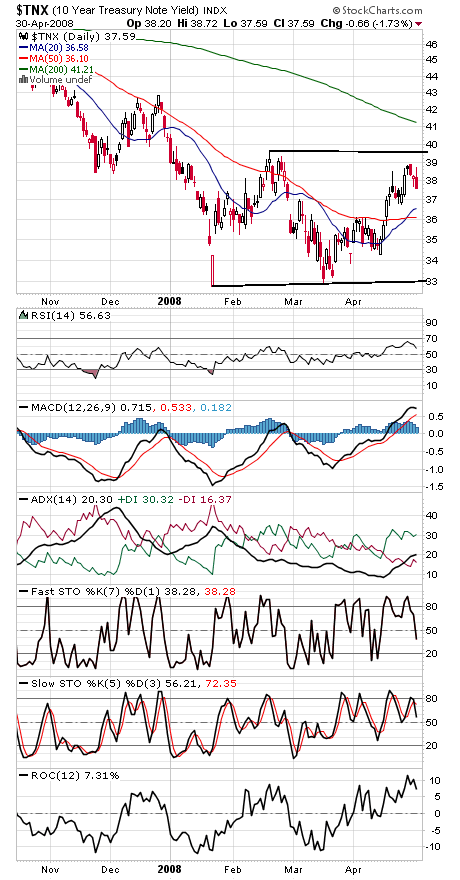
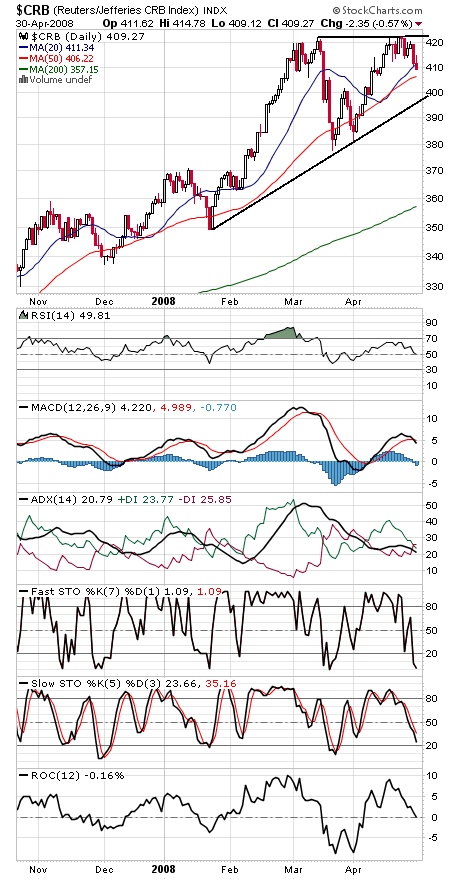
Finally, the dollar, bonds and commodities (charts four, five and six) have been trying to reverse, but today’s Fed statement could delay that unwinding a while longer.
Paul Shread is a Chartered Market Technician (CMT) and member of the Market Technicians Association.