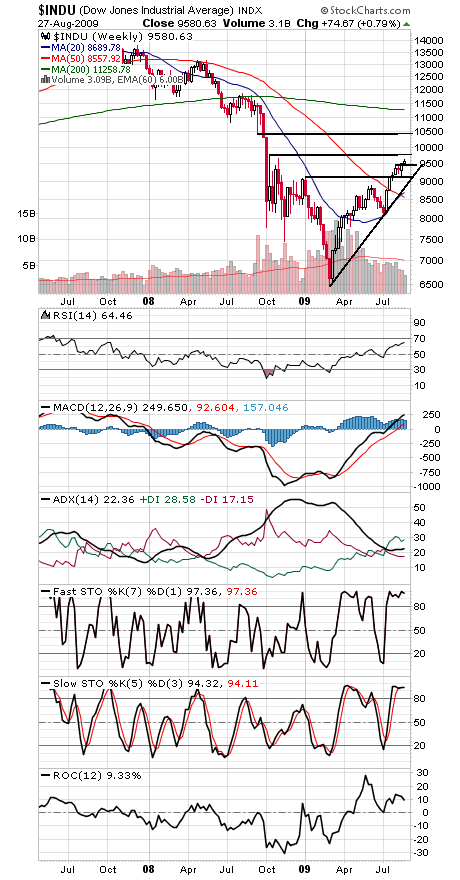
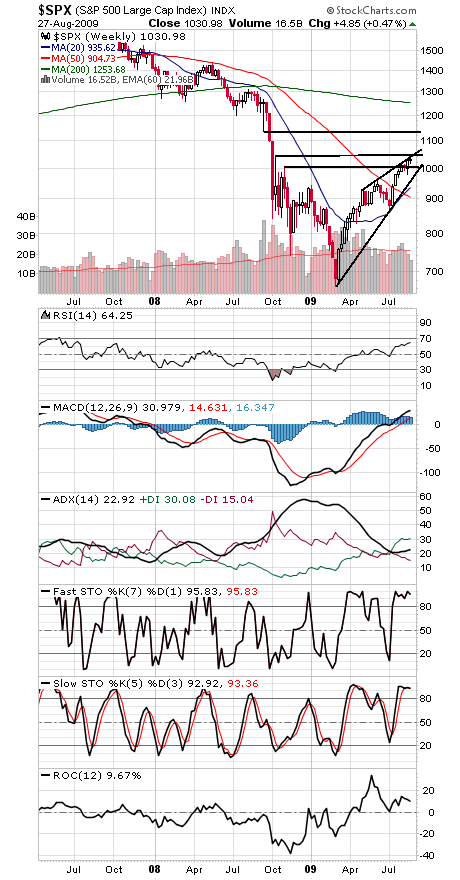
The Dow and S&P (first two charts below) have stalled just below their mid-October 2008 highs, a level hit just briefly in the weeks following the implosion of Lehman Brothers and AIG.
Those levels are 1044.31 on the S&P and 9654-9794 on the Dow. If the indexes can clear those levels, next up for the S&P is 1100-1133 and 10,000-10,459 on the Dow.
So far the market is behaving as expected in the wake of last month’s Dow Theory bull signal, with pullbacks remaining shallow thus far.
The 9437 level is first support on the Dow, with 9000-9095 below that. The S&P has support at 1016-1018, 1007, 1000 and 978-980.
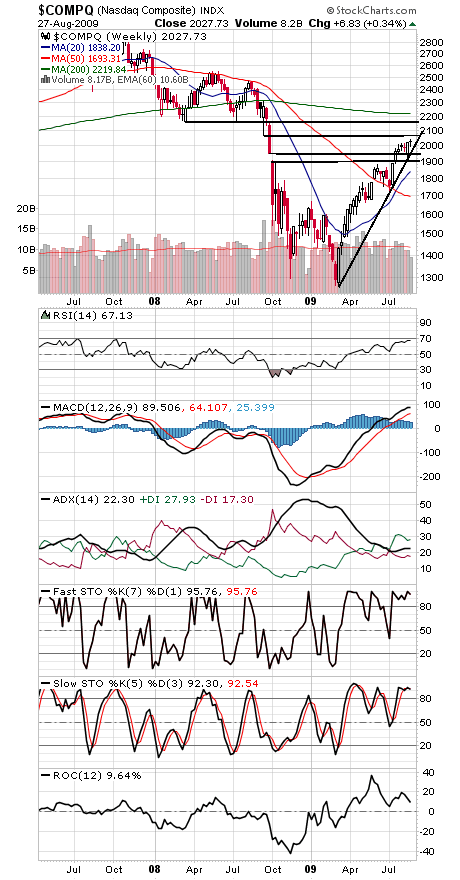
The Nasdaq (third chart) has support at 1960 this week and then 1980-2000 the next two weeks (a sharply rising uptrend line). The next upside hurdles are 2070 and 2155, as the techs approach the 2200 level that acted as support for the first eight months of 2008. No small test for the tech sector there.
Finally, we’d note that at 51.6 percent bulls to 19.8 percent bears, the Investors Intelligence weekly sentiment survey is perhaps getting a little too bullish, especially considering that signs of economic recovery remain few and far between. It’s at levels last seen in late 2007. As always, price matters most, but sentiment and other indicators are worth keeping an eye on.
Paul Shread is a Chartered Market Technician (CMT) and member of the Market Technicians Association. He is a co-author of the book “Dow Theory Unplugged” from W&A Publishing.