Technical Analysis: Stocks Stay Stuck | Internet News

Technical Analysis: Stocks Stay Stuck

Written By
Paul Shread
Paul Shread
Jan 3, 2008
1 minute read

The two strongest months of the year could do nothing to break the market out of its six-month trading range. And election years tend to be choppy, so there’s no guarantee that the indexes will break out any time soon.

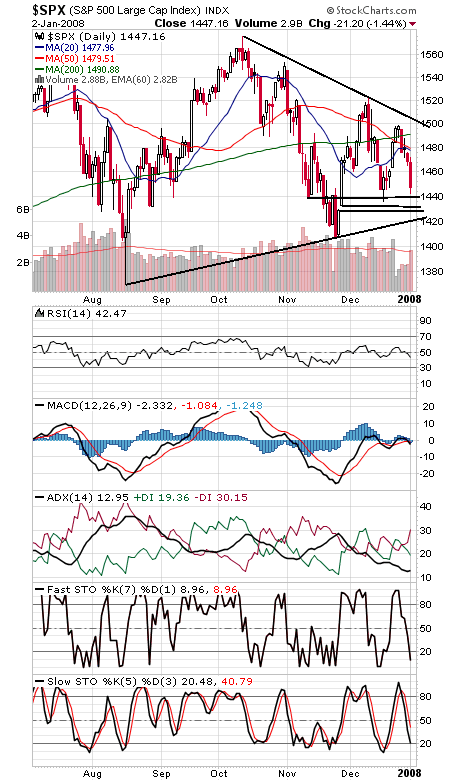
The S&P 500 (see first chart below) remains stuck near the bottom of its trading range. If it goes much below 1440, 1428-1432 and 1420 come into play, while 1480-1500 remains a big hurdle to the upside.

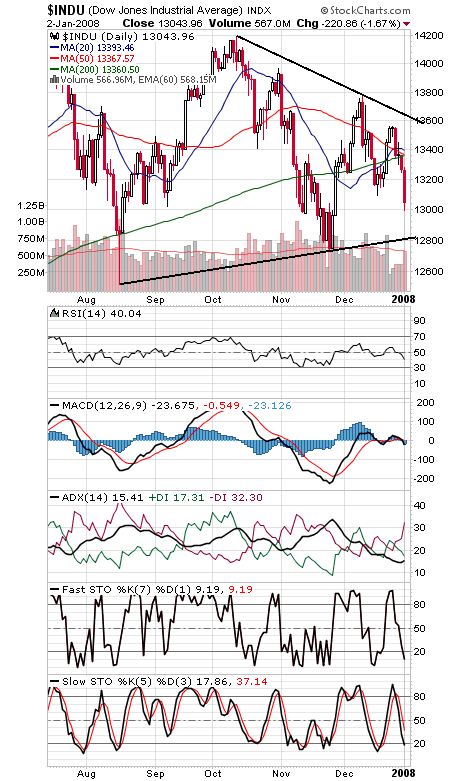
If 13,000 goes on the Dow (second chart), 12,800 could be next. To the upside, 13,360 is a big resistance area.

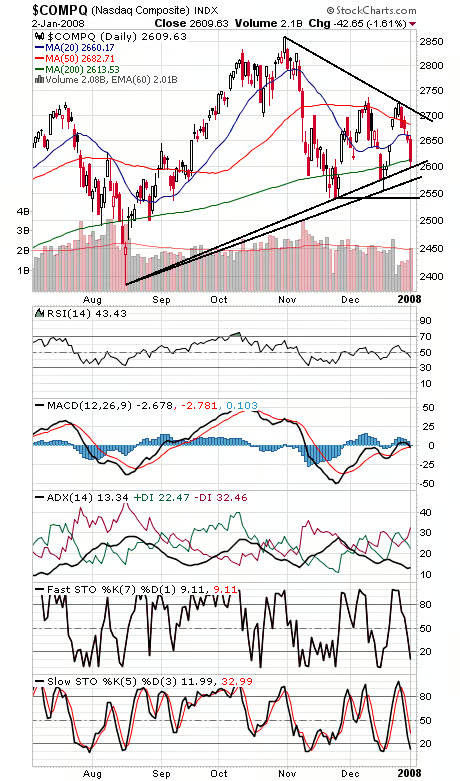
The Nasdaq (third chart) has support here at 2600, with 2590 and 2540-2550 below that. Resistance is 2650-2660, 2680 and 2700.

In short, still a very range-bound market, but one that could get a lift later this month in anticipation of more rate cuts.

Paul Shread is a Chartered Market Technician (CMT) and member of the Market Technicians Association.

Internet News Logo

InternetNews is a source of industry news and intelligence for IT professionals from all branches of the technology world. InternetNews focuses on helping professionals grow their knowledge base and authority in their field with the top news and trends in Software, IT Management, Networking & Communications, and Small Business.

Property of TechnologyAdvice. © 2026 TechnologyAdvice. All Rights Reserved

Advertiser Disclosure: Some of the products that appear on this site are from companies from which TechnologyAdvice receives compensation. This compensation may impact how and where products appear on this site including, for example, the order in which they appear. TechnologyAdvice does not include all companies or all types of products available in the marketplace.