Technical Analysis: Stocks Stay Stuck | Internet News

Technical Analysis: Stocks Stay Stuck

Written By
Paul Shread
Paul Shread
Sep 12, 2006
1 minute read


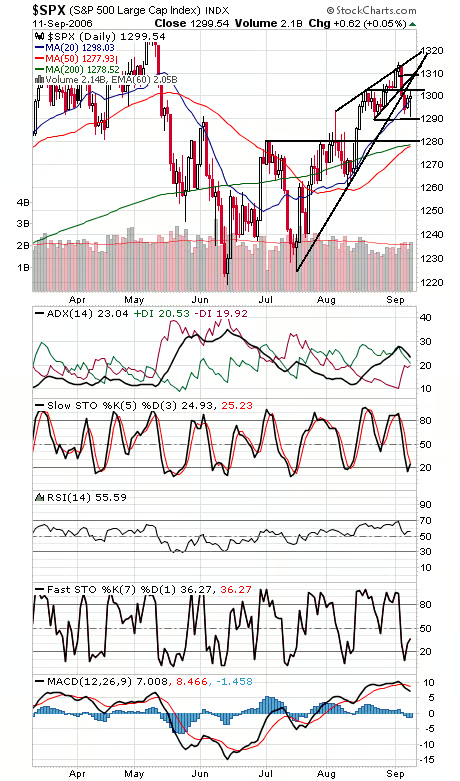
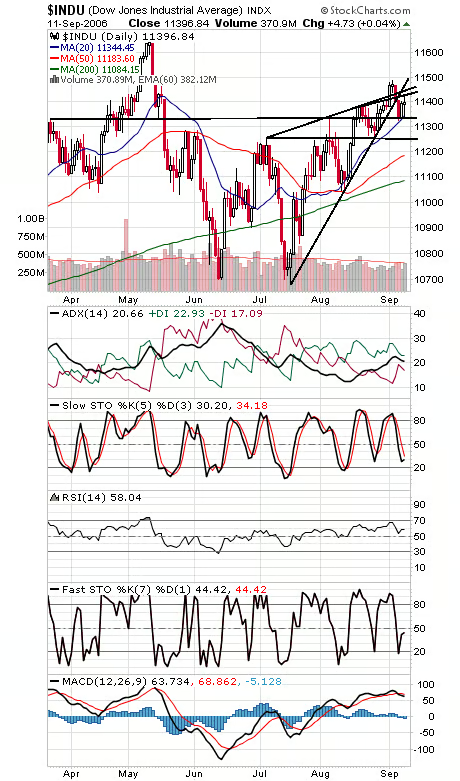
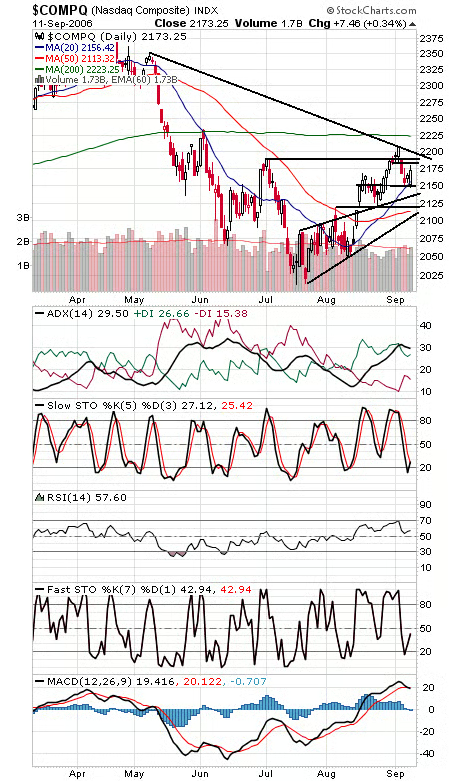
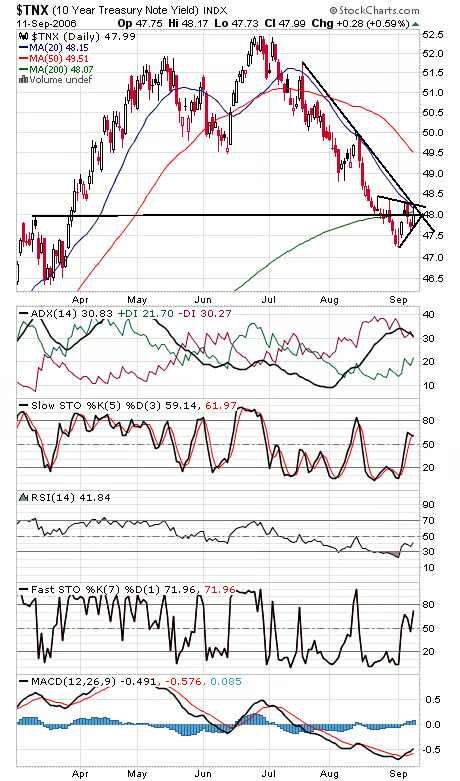
The S&P (first chart below) could be forming a head-and-shoulders top over the last few weeks, and coming on the heels of last week’s uptrend break too: a couple of patterns favoring the bears here. A move above 1303 could negate the head-and-shoulders top, but 1309 looks like rock-solid resistance for now. 1289-1291 is important first support, with 1278-1281 below that. The Dow (second chart) faces resistance at 11,425, 11,460 and 11,500, and support is 11,350, 11,320 and 11,250. The Nasdaq (third chart) faces resistance at 2183, 2190-2193 and 2200, and support at 2150 (2147) is so far holding, with 2137 below that. Bond yields (fourth chart) still haven’t put in a convincing reversal and so far look like a consolidation in a downtrend.


Internet News Logo

InternetNews is a source of industry news and intelligence for IT professionals from all branches of the technology world. InternetNews focuses on helping professionals grow their knowledge base and authority in their field with the top news and trends in Software, IT Management, Networking & Communications, and Small Business.

Property of TechnologyAdvice. © 2026 TechnologyAdvice. All Rights Reserved

Advertiser Disclosure: Some of the products that appear on this site are from companies from which TechnologyAdvice receives compensation. This compensation may impact how and where products appear on this site including, for example, the order in which they appear. TechnologyAdvice does not include all companies or all types of products available in the marketplace.