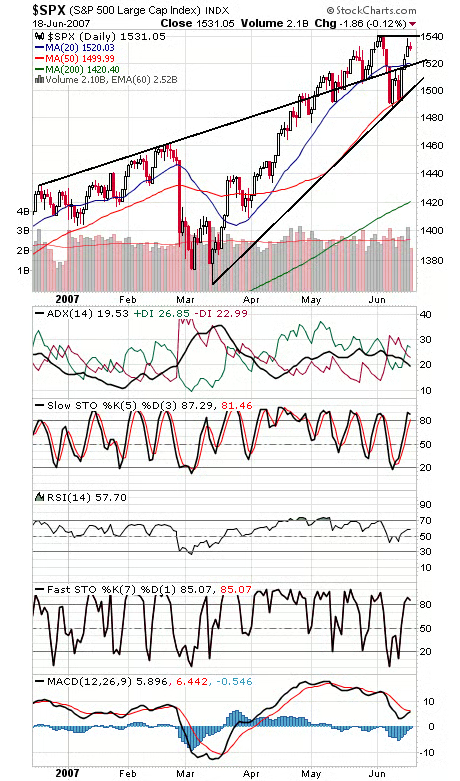
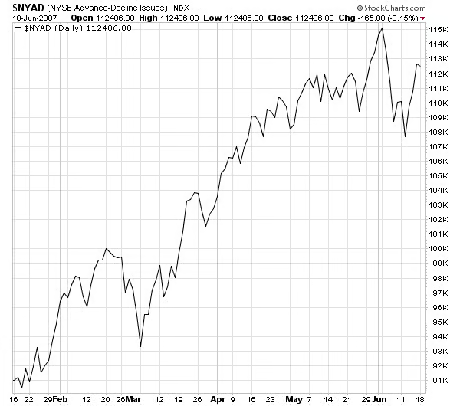
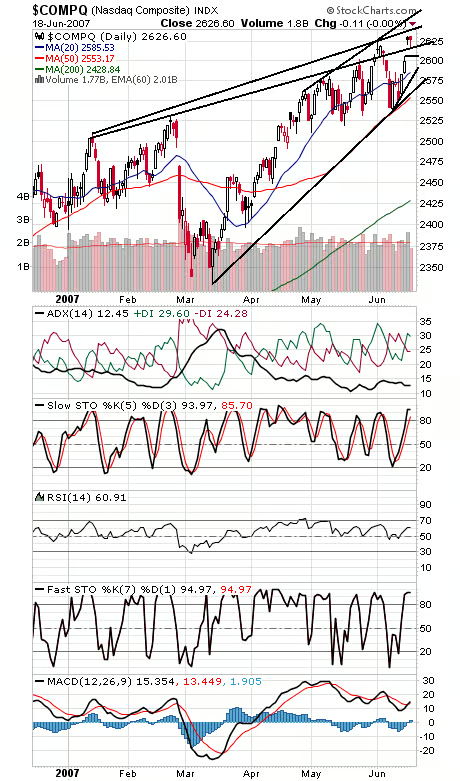
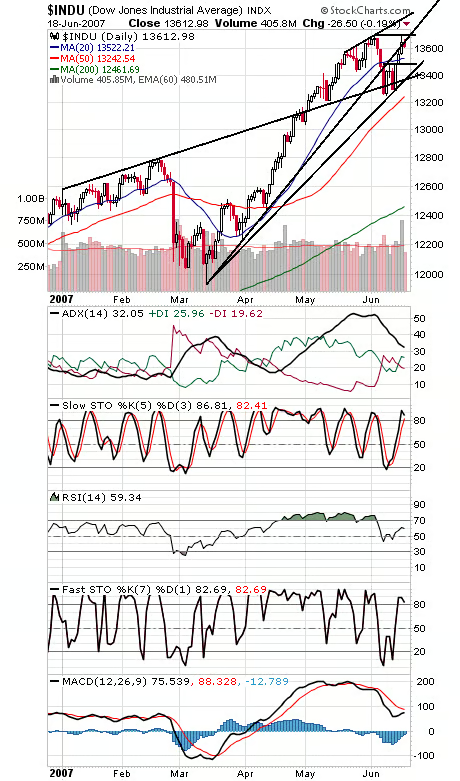
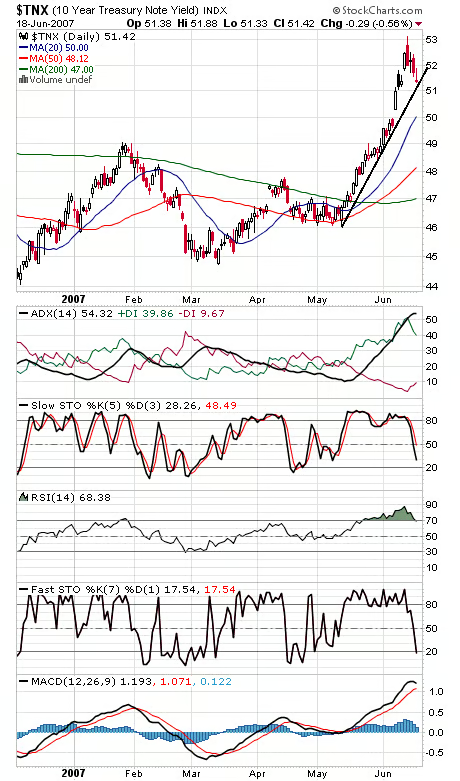
1552.87, the S&P’s (first chart below) all-time intraday high set seven years ago, continues to be a problem for the market and could well turn out to mark a high of some import. Advisors are becoming a little too bullish, commercial futures traders are doing a little too much shorting, and we’re also starting to see a little deterioration in market internals, with the NYSE advance-decline line (second chart) still some distance from its high set at the start of the month. On the plus side, options indicators have yet to get frothy, but in general, caution appears to be the watchword as the traditional autumn weak spot approaches. 1540 is first resistance for the S&P, and 1527, 1523-1525 and 1520 are support. First resistance for the Nasdaq (third chart) is 2640, and 2617-2618 and 2600-2605 are support. 13,692-13,700 is tough first resistance for the Dow (fourth chart), and 13,600 and 13,480-13,520 are support. The 10-year yield (fifth chart) is sitting right on support here.
Paul Shread is a Chartered Market Technician (CMT) and member of the Market Technicians Association