SHARE
Facebook X Pinterest WhatsApp

Technical Analysis: Stocks Stay Stuck

Written By
thumbnail
Paul Shread
Paul Shread
Dec 14, 2005

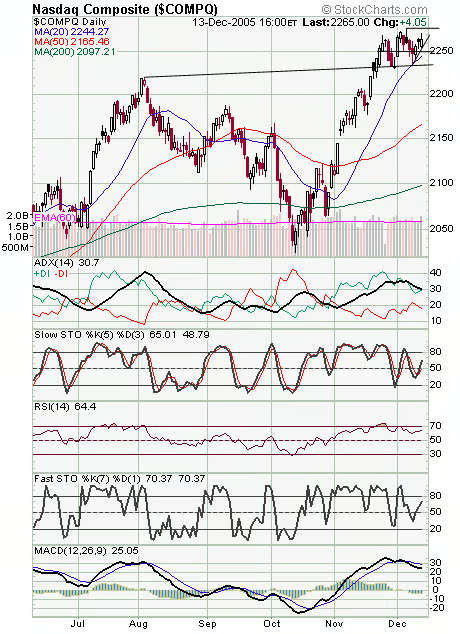
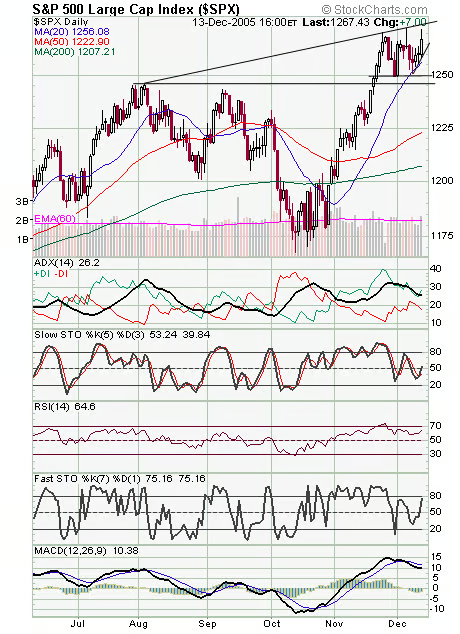
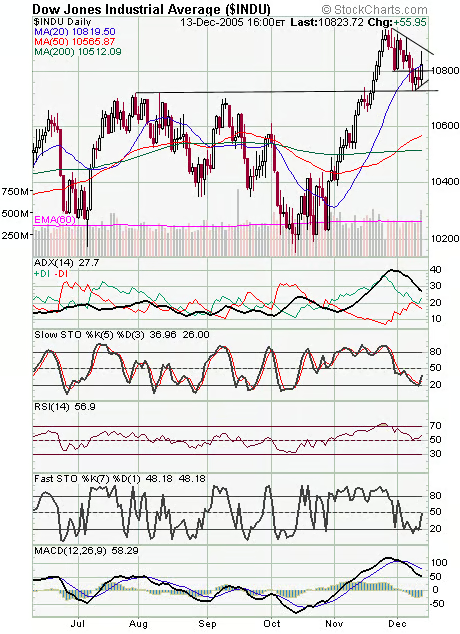
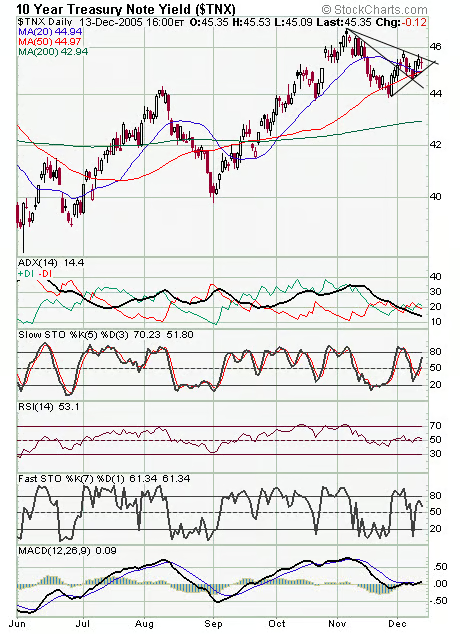
No help for a range-bound market today. The Nasdaq (first chart below) needs to clear its recent high at 2278 to avoid looking toppy here. Support is 2260, 2250 and 2234. The S&P (second chart) faces major resistance at 1275 and 1285. Support is 1261-1265, 1250 and 1246. The Dow (third chart) is the one index in a genuine downtrend. Resistance is 10,880 and 10,950-11,000, and support is 10,720-10,750. Long bonds (fourth chart) gave a collective yawn at the Fed’s decision today, and it’s easy to see why — two more rate hikes and the Fed funds rate will be higher than the 10-year yield. Bonds don’t have much room here at all, thanks to pressure from the Fed.


Recommended for you...

U.S. Needs to Protect Tech Leadership: Qualcomm
Rob Enderle
Apr 8, 2022
HP’s ExtendXR Service Gets an Early Lead on a Looming Metaverse Problem
Rob Enderle
Mar 5, 2022
Cisco’s Purpose Is to Improve the World. Imagine if Others Followed.
Rob Enderle
Dec 17, 2021
HP Builds an Advanced Cloud Workstation for the Metaverse
Rob Enderle
Nov 13, 2021
Internet News Logo

InternetNews is a source of industry news and intelligence for IT professionals from all branches of the technology world. InternetNews focuses on helping professionals grow their knowledge base and authority in their field with the top news and trends in Software, IT Management, Networking & Communications, and Small Business.

Property of TechnologyAdvice. © 2025 TechnologyAdvice. All Rights Reserved

Advertiser Disclosure: Some of the products that appear on this site are from companies from which TechnologyAdvice receives compensation. This compensation may impact how and where products appear on this site including, for example, the order in which they appear. TechnologyAdvice does not include all companies or all types of products available in the marketplace.