A strong rally attempt today, but is it enough for a major bottom? Two levels could tell us that, but first, a look at sentiment.
The 22-year-old American Association of Individual Investors (AAII) survey hit an all-time high of 70% bears last week; that’s a very market-bullish number. At the same time, however, put-call ratios don’t seem to be showing nearly as much fear. We’ll give the edge to the AAII survey because there are other ways to express fear than to buy puts, but we’d like to see the Investors Intelligence survey hit bearish extremes for confirmation. The latest reading from the Investors Intelligence advisors survey showed a 47-26 bear to bull ratio, not nearly as extreme as the 54-22 ratio we saw in November.
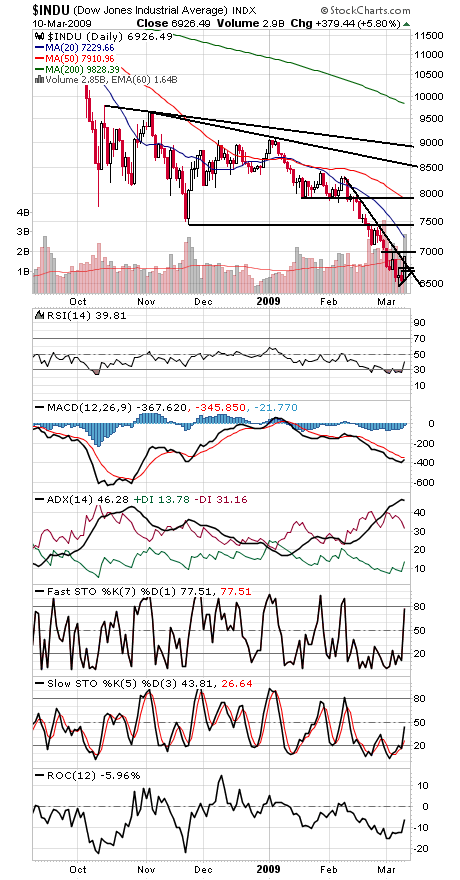
And now for a look back at history. The most optimistic scenario at this point would be a bear market similar to 1966-1974, with the caveat that the 2000-2008 percentage losses are already worse. Note that in the 1966-1974 bear market (first chart below, courtesy of MSN MoneyCentral), the market undercut its previous bear market lows in 1970 and 1974, then completed a bottoming process when it was able to reclaim and hold those levels. That makes the 2002 lows of 7200-7500 on the Dow and 768-789 on the S&P doubly important resistance until they’re cleared for good.
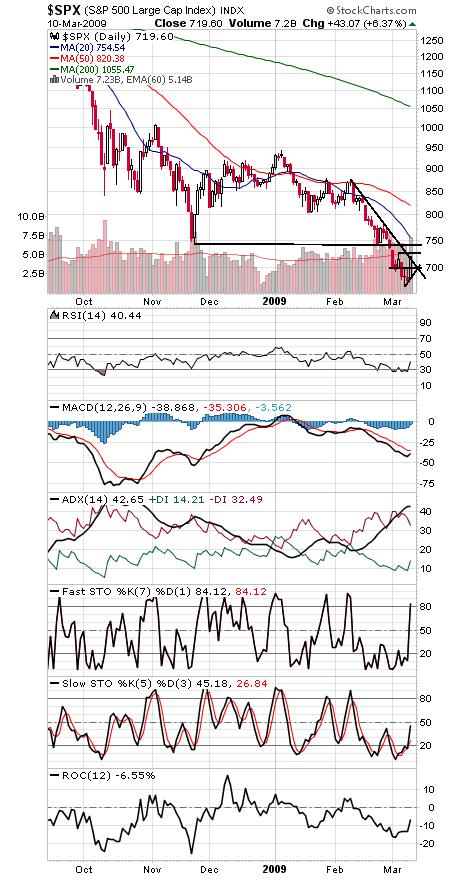
First up for the market is 7000 on the Dow and 724 on the S&P, and then the S&P’s November low of 741 (see charts two and three below). Support is now 690-710 on the S&P and 6650-6755 on the Dow.
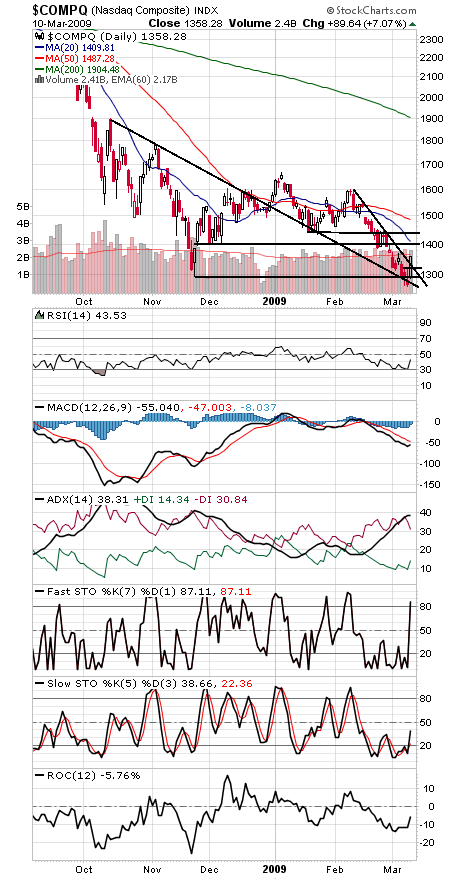
The Nasdaq (fourth chart) has support at 1300-1320, and resistance at 1400 and 1440.
Paul Shread is a Chartered Market Technician (CMT) and member of the Market Technicians Association. He is a co-author of an upcoming book on Dow Theory from W&A Publishing.