SHARE
Facebook X Pinterest WhatsApp

Technical Analysis: Stocks Turn Lower

Written By
thumbnail
Paul Shread
Paul Shread
Aug 10, 2006

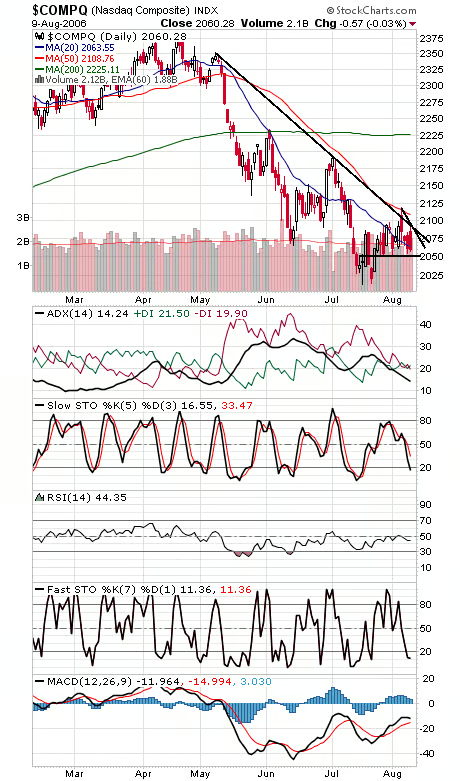
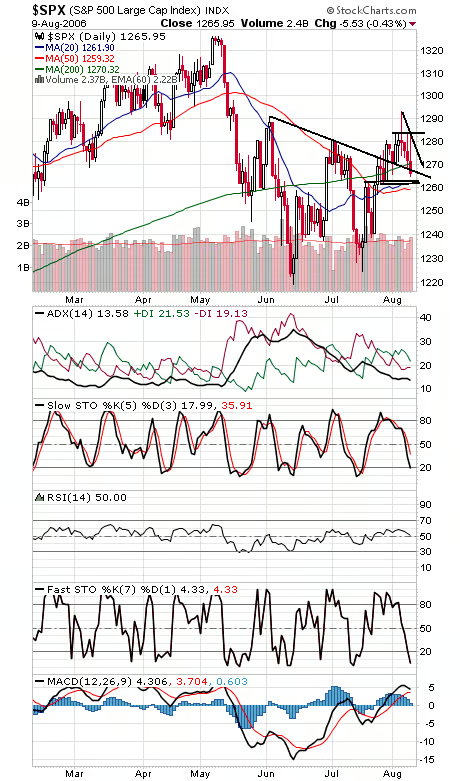
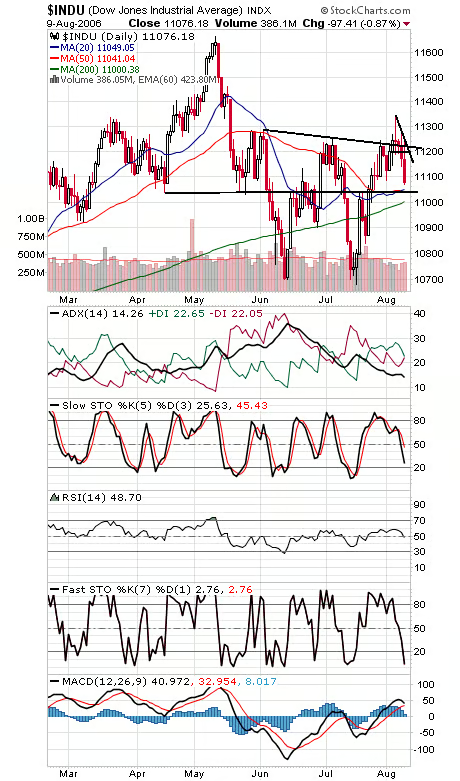
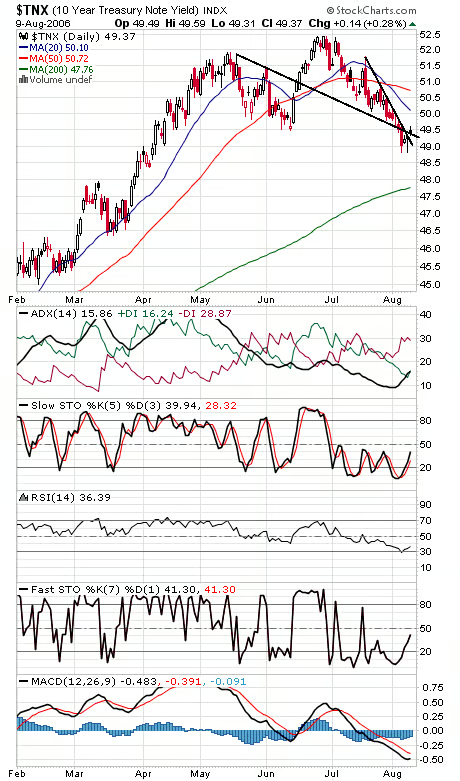
Sellers continue to gain the upper hand, thwarting another rally here, as the indexes continue to look like another leg down lies ahead. The Nasdaq (first chart below) has important first support at 2050, and resistance is 2090-2100. The S&P (second chart) ran into a wall at 1284 again today. First resistance levels are 1267, 1270 and 1280, and support is 1262-1263 and 1259. The Dow (third chart) has major support at 11,000-11,040, and resistance is 11,190-11,220. Bond traders (fourth chart) are so far selling the news too.


Recommended for you...

U.S. Needs to Protect Tech Leadership: Qualcomm
Rob Enderle
Apr 8, 2022
HP’s ExtendXR Service Gets an Early Lead on a Looming Metaverse Problem
Rob Enderle
Mar 5, 2022
Cisco’s Purpose Is to Improve the World. Imagine if Others Followed.
Rob Enderle
Dec 17, 2021
HP Builds an Advanced Cloud Workstation for the Metaverse
Rob Enderle
Nov 13, 2021
Internet News Logo

InternetNews is a source of industry news and intelligence for IT professionals from all branches of the technology world. InternetNews focuses on helping professionals grow their knowledge base and authority in their field with the top news and trends in Software, IT Management, Networking & Communications, and Small Business.

Property of TechnologyAdvice. © 2025 TechnologyAdvice. All Rights Reserved

Advertiser Disclosure: Some of the products that appear on this site are from companies from which TechnologyAdvice receives compensation. This compensation may impact how and where products appear on this site including, for example, the order in which they appear. TechnologyAdvice does not include all companies or all types of products available in the marketplace.