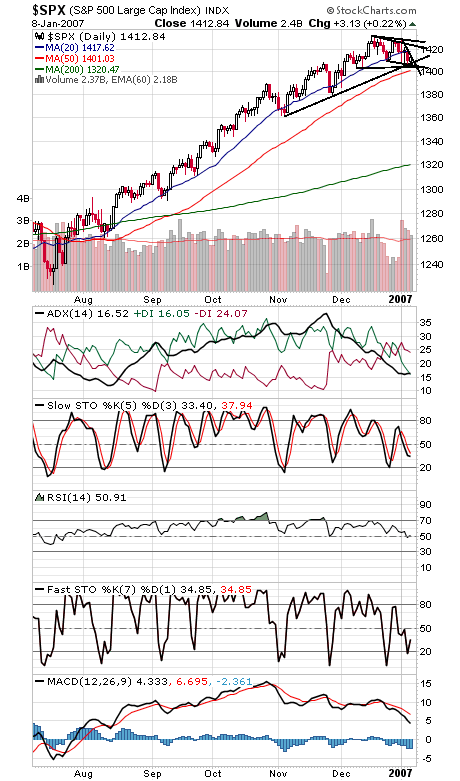
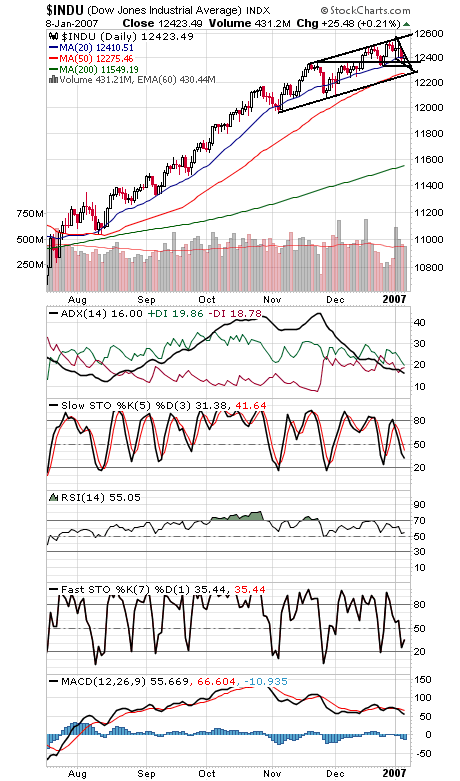
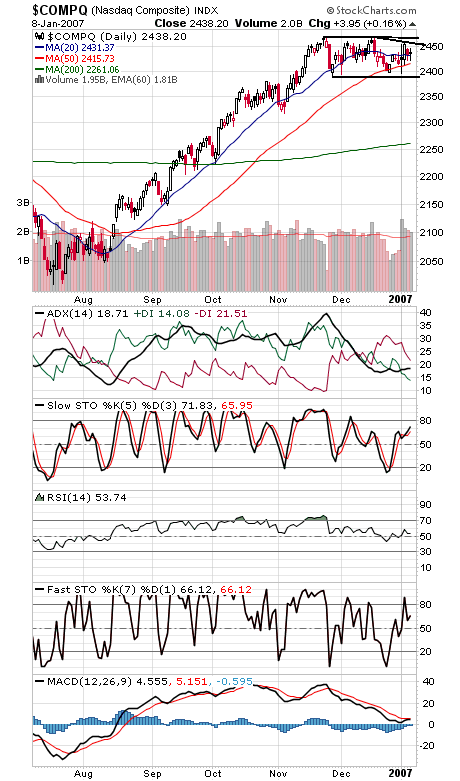
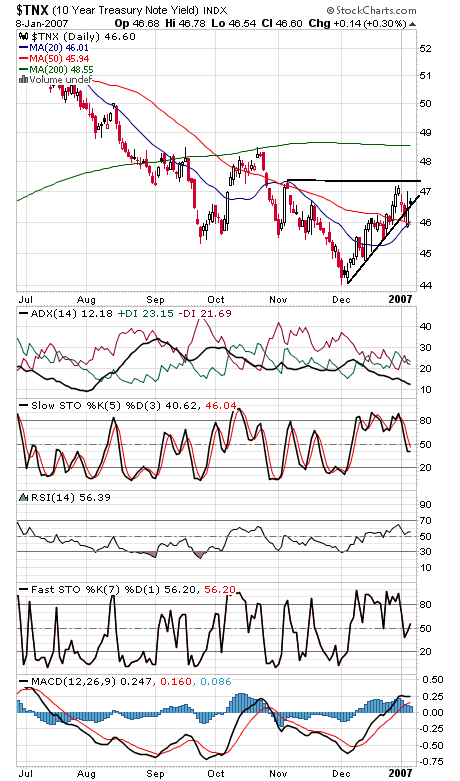
With little in the way of news this week, save for retail sales data on Friday, stocks will have to look hard to find a catalyst ahead of next week’s earnings deluge. Still, while stocks have been in a corrective phase in recent weeks, the choppy, overlapping and shallow nature of the correction is potentially bullish. Now all we need are buyers. The S&P (first chart below) has a bunch of support around 1402-1404. To the upside, resistance is 1415, 1418, 1420-1423 and 1428-1432. The Dow (second chart) has support at 12,380, 12,337 and 12,275, and resistance is 12,450, 12,480-12,500 and 12,560-12,580. The Nasdaq (third chart) has support at 2417-2420, and resistance is 2445, 2455 and 2471. Bond yields (fifth chart) still aren’t providing much support for stocks.


